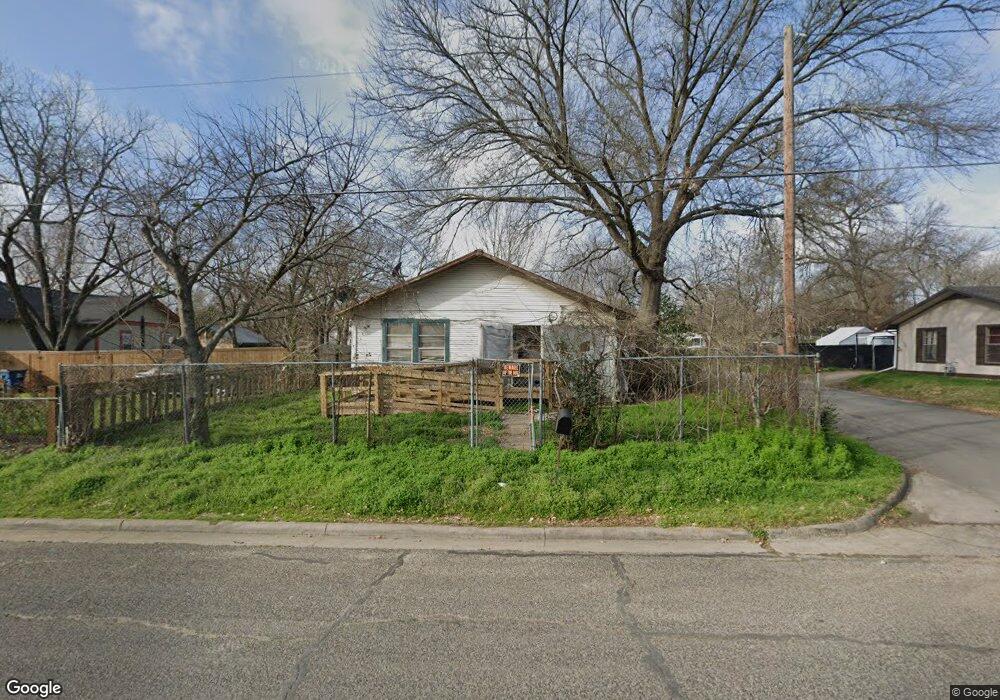
820 N 19th St Corsicana, TX 75110
Estimated Value: $70,045 - $180,000
--
Bed
--
Bath
1,078
Sq Ft
$133/Sq Ft
Est. Value
About This Home
This home is located at 820 N 19th St, Corsicana, TX 75110 and is currently estimated at $143,511, approximately $133 per square foot. 820 N 19th St is a home located in Navarro County with nearby schools including Corsicana High School.
Ownership History
Date
Name
Owned For
Owner Type
Purchase Details
Closed on
May 28, 2025
Sold by
Ivie John R
Bought by
Espinoza Rigoberto M
Current Estimated Value
Purchase Details
Closed on
May 7, 2025
Sold by
Olsen Dunn Lowell
Bought by
Jvie John R
Purchase Details
Closed on
May 18, 2017
Sold by
Ivie Patricia Diane
Bought by
Cooper Joyce R
Home Financials for this Owner
Home Financials are based on the most recent Mortgage that was taken out on this home.
Original Mortgage
$10,000
Interest Rate
4.1%
Mortgage Type
Seller Take Back
Create a Home Valuation Report for This Property
The Home Valuation Report is an in-depth analysis detailing your home's value as well as a comparison with similar homes in the area
Home Values in the Area
Average Home Value in this Area
Purchase History
| Date | Buyer | Sale Price | Title Company |
|---|---|---|---|
| Espinoza Rigoberto M | $55,000 | None Listed On Document | |
| Jvie John R | $9,060 | None Listed On Document | |
| Cooper Joyce R | -- | None Available |
Source: Public Records
Mortgage History
| Date | Status | Borrower | Loan Amount |
|---|---|---|---|
| Previous Owner | Cooper Joyce R | $10,000 |
Source: Public Records
Tax History Compared to Growth
Tax History
| Year | Tax Paid | Tax Assessment Tax Assessment Total Assessment is a certain percentage of the fair market value that is determined by local assessors to be the total taxable value of land and additions on the property. | Land | Improvement |
|---|---|---|---|---|
| 2025 | $796 | $42,050 | $23,560 | $18,490 |
| 2024 | $644 | $33,989 | $21,750 | $19,370 |
| 2023 | $188 | $30,899 | $21,750 | $19,050 |
| 2022 | $650 | $28,090 | $9,060 | $19,030 |
| 2021 | $679 | $26,120 | $9,060 | $17,060 |
| 2020 | $693 | $26,120 | $9,060 | $17,060 |
| 2019 | $706 | $25,690 | $9,060 | $16,630 |
| 2018 | $656 | $23,880 | $7,250 | $16,630 |
| 2017 | $640 | $23,340 | $7,250 | $16,090 |
| 2016 | $577 | $21,020 | $7,250 | $13,770 |
| 2015 | -- | $21,020 | $7,250 | $13,770 |
| 2014 | -- | $21,020 | $7,250 | $13,770 |
Source: Public Records
Map
Nearby Homes