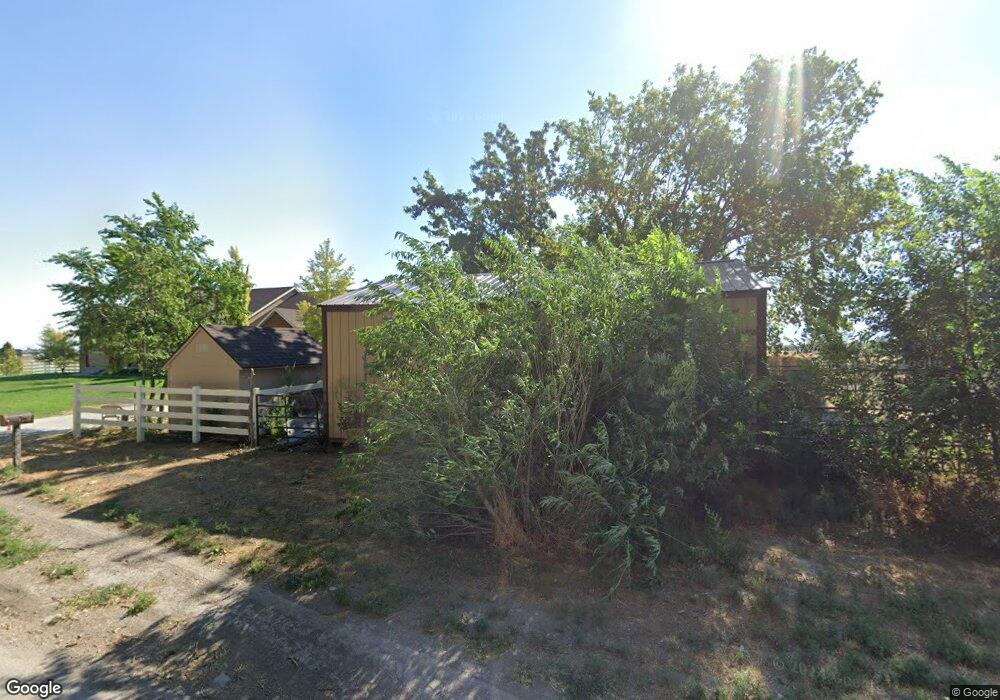
820 N Cooley St Grantsville, UT 84029
Estimated Value: $871,000 - $1,272,357
1
Bed
4
Baths
372
Sq Ft
$2,740/Sq Ft
Est. Value
About This Home
This home is located at 820 N Cooley St, Grantsville, UT 84029 and is currently estimated at $1,019,452, approximately $2,740 per square foot. 820 N Cooley St is a home located in Tooele County with nearby schools including Grantsville Elementary School, Grantsville Junior High School, and Grantsville High School.
Ownership History
Date
Name
Owned For
Owner Type
Purchase Details
Closed on
Apr 18, 2018
Sold by
Hawks Randle
Bought by
Hawks Randle and Hawks Corri
Current Estimated Value
Home Financials for this Owner
Home Financials are based on the most recent Mortgage that was taken out on this home.
Original Mortgage
$450,000
Outstanding Balance
$387,172
Interest Rate
4.46%
Mortgage Type
New Conventional
Estimated Equity
$632,280
Purchase Details
Closed on
May 29, 2013
Sold by
Schultz Marie S and Sheranian Michael Judd
Bought by
Holmes Jessica and Holmes Gregg
Home Financials for this Owner
Home Financials are based on the most recent Mortgage that was taken out on this home.
Original Mortgage
$342,000
Interest Rate
3.38%
Mortgage Type
New Conventional
Create a Home Valuation Report for This Property
The Home Valuation Report is an in-depth analysis detailing your home's value as well as a comparison with similar homes in the area
Home Values in the Area
Average Home Value in this Area
Purchase History
| Date | Buyer | Sale Price | Title Company |
|---|---|---|---|
| Hawks Randle | -- | Metro National Title | |
| Hawks Randle | -- | Title Guarantee River Park | |
| Holmes Jessica | -- | First American Title Company |
Source: Public Records
Mortgage History
| Date | Status | Borrower | Loan Amount |
|---|---|---|---|
| Open | Hawks Randle | $450,000 | |
| Previous Owner | Holmes Jessica | $342,000 |
Source: Public Records
Tax History Compared to Growth
Tax History
| Year | Tax Paid | Tax Assessment Tax Assessment Total Assessment is a certain percentage of the fair market value that is determined by local assessors to be the total taxable value of land and additions on the property. | Land | Improvement |
|---|---|---|---|---|
| 2025 | $9,143 | $484,608 | $116,431 | $368,177 |
| 2024 | $9,143 | $746,448 | $267,245 | $479,203 |
| 2023 | $9,143 | $1,111,702 | $546,091 | $565,611 |
| 2022 | $5,134 | $741,515 | $375,397 | $366,118 |
| 2021 | $7,026 | $527,356 | $192,995 | $334,361 |
| 2020 | $6,494 | $699,207 | $249,245 | $449,962 |
| 2019 | $4,355 | $495,295 | $156,680 | $338,615 |
| 2018 | $4,369 | $464,512 | $156,680 | $307,832 |
| 2017 | $3,904 | $436,527 | $156,680 | $279,847 |
| 2016 | $3,806 | $262,853 | $122,930 | $139,923 |
| 2015 | $3,806 | $262,853 | $0 | $0 |
| 2014 | -- | $196,010 | $0 | $0 |
Source: Public Records
Map
Nearby Homes
- 841 N Hale St Unit 1
- 340 W Wrathall Ln
- 356 N Wrathall Cir
- 327 N 600 W
- 1097 N Industrial Park Cir
- 497 Old Lincoln Hwy
- 600 W Clark St
- 500 W Clark St
- 407 W Richard St
- 159 E North St
- 49 Tiebreaker Cir
- 727 W Island Vista Cir
- 26 N Wayne Way
- 39 N Wayne Way
- 37 N Wayne Way
- 55 S Cooley St
- 643 W Banner Dr
- 653 W Banner Dr
- 655 W Banner Dr Unit 1042
- 282 W Apple St
- 852 N Cooley St Unit 2
- 852 N Cooley St
- 249 E Pioneer Rose Ln Unit 3
- 598 N Cooley St
- 650 Warr St
- 841 N Pheasant Run Ln Unit 1
- 841 N Pheasant Run Ln
- 841 N Hale St
- 233 W Vegas St Unit 6
- 557 N Cooley St Unit 4
- 583 N Cooley St Unit 3
- 627 N Cooley St Unit 3
- 867 N Hale St Unit 2
- 628 Warr St
- 446 Picadilly Rd
- 401 Picadilly Rd
- 197 W Vegas St
- 610 Warr St
- 185 W Vegas St Unit 3
- 596 Warr St