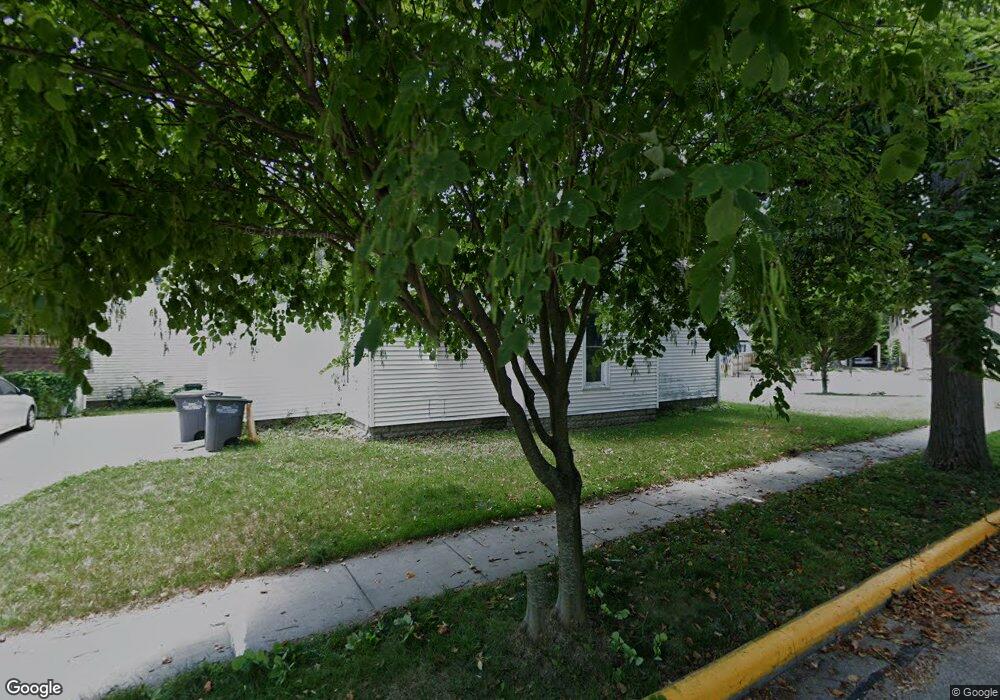
820 Robinson St West Lafayette, IN 47906
Estimated Value: $250,000 - $372,000
--
Bed
--
Bath
777
Sq Ft
$370/Sq Ft
Est. Value
About This Home
This home is located at 820 Robinson St, West Lafayette, IN 47906 and is currently estimated at $287,801, approximately $370 per square foot. 820 Robinson St is a home located in Tippecanoe County with nearby schools including West Lafayette Intermediate School, West Lafayette Elementary School, and West Lafayette Junior/Senior High School.
Ownership History
Date
Name
Owned For
Owner Type
Purchase Details
Closed on
Dec 22, 2009
Sold by
Susong John C and Susong Michael A
Bought by
Susong Michael A
Current Estimated Value
Purchase Details
Closed on
Mar 21, 2002
Sold by
Ginn Steven T and Ginn Julie J
Bought by
Ginn Robin Properties Llc
Home Financials for this Owner
Home Financials are based on the most recent Mortgage that was taken out on this home.
Original Mortgage
$96,800
Interest Rate
6.93%
Create a Home Valuation Report for This Property
The Home Valuation Report is an in-depth analysis detailing your home's value as well as a comparison with similar homes in the area
Home Values in the Area
Average Home Value in this Area
Purchase History
| Date | Buyer | Sale Price | Title Company |
|---|---|---|---|
| Susong Michael A | -- | Sojourners Title Agency | |
| Ginn Robin Properties Llc | -- | -- |
Source: Public Records
Mortgage History
| Date | Status | Borrower | Loan Amount |
|---|---|---|---|
| Previous Owner | Ginn Robin Properties Llc | $96,800 |
Source: Public Records
Tax History Compared to Growth
Tax History
| Year | Tax Paid | Tax Assessment Tax Assessment Total Assessment is a certain percentage of the fair market value that is determined by local assessors to be the total taxable value of land and additions on the property. | Land | Improvement |
|---|---|---|---|---|
| 2024 | $5,109 | $215,500 | $61,000 | $154,500 |
| 2023 | $3,828 | $161,500 | $61,000 | $100,500 |
| 2022 | $3,829 | $161,500 | $61,000 | $100,500 |
| 2021 | $3,419 | $144,200 | $61,000 | $83,200 |
| 2020 | $3,410 | $143,800 | $61,000 | $82,800 |
| 2019 | $3,343 | $141,000 | $61,000 | $80,000 |
| 2018 | $3,215 | $135,600 | $58,900 | $76,700 |
| 2017 | $2,644 | $111,500 | $58,900 | $52,600 |
| 2016 | $3,127 | $131,900 | $58,900 | $73,000 |
| 2014 | $2,916 | $123,000 | $58,900 | $64,100 |
| 2013 | $2,900 | $122,300 | $58,900 | $63,400 |
Source: Public Records
Map
Nearby Homes
- 229 Connolly St
- 238 Connolly St
- 237 E Sunset Ln
- 845 Rose St
- 805 N Chauncey Ave
- 306 E Stadium Ave
- 1411 N Salisbury St
- 1220 Ravinia Rd
- 320 Brown St
- 618 Northridge Dr
- 502 Hillcrest Rd
- 509 Carrolton Blvd
- 500 Carrolton Blvd
- 701 Carrolton Blvd
- 1868 N River Rd
- 1909 Indian Trail Dr
- 1000 Hartford St
- 1912 Indian Trail Dr
- 511 N 7th St
- 1831 N 13th St
- 816 Robinson St
- 217 Connolly St
- 221 Connolly St
- 206 Connolly St
- 900 Robinson St
- 825 Robinson St
- 821 Robinson St
- 216 Connolly St
- 200 Dehart St
- 225 Connolly St
- 220 Connolly St
- 132 Dehart St
- 136 Dehart St
- 202 Dehart St
- 224 Connolly St
- 128 Dehart St
- 127 Connolly St
- 230 Connolly St
- 124 Connolly St
- 219 Lincoln St