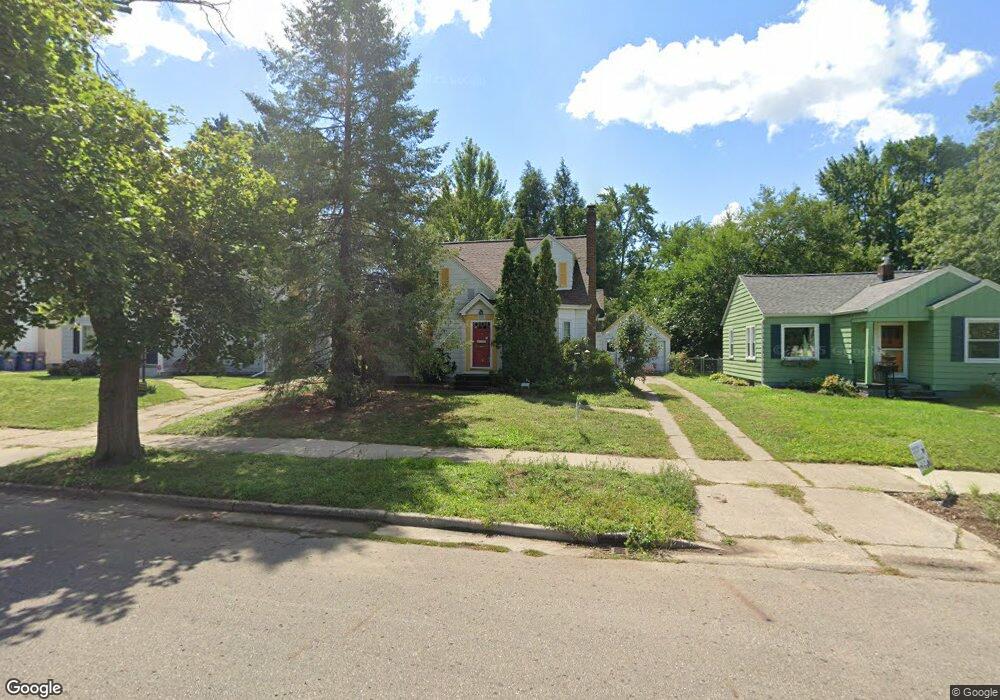
820 S Ottillia St SE Grand Rapids, MI 49507
Alger Heights NeighborhoodEstimated Value: $335,000 - $361,000
4
Beds
2
Baths
2,100
Sq Ft
$164/Sq Ft
Est. Value
About This Home
This home is located at 820 S Ottillia St SE, Grand Rapids, MI 49507 and is currently estimated at $344,373, approximately $163 per square foot. 820 S Ottillia St SE is a home located in Kent County with nearby schools including Brookside Elementary School, Alger Middle School, and Ottawa Hills High School.
Ownership History
Date
Name
Owned For
Owner Type
Purchase Details
Closed on
Oct 23, 2020
Sold by
Brouwer Marilyn
Bought by
Broliwer Marilyn and The Marilyn Broliwer Living Trust
Current Estimated Value
Purchase Details
Closed on
Jul 24, 2013
Sold by
Brouwer Marilyn
Bought by
Brouwer Marilyn
Purchase Details
Closed on
Jul 23, 2007
Sold by
Kwant Clarice D and Brouwer Marilyn
Bought by
Brouwer Marilyn and Marilyn Brouwer Living Trust
Purchase Details
Closed on
Feb 21, 2003
Sold by
Keessen Jeffrey and Keesen Jennifer A
Bought by
Brouwer Winifred B and Winifred B Brouwer Living Trust
Purchase Details
Closed on
Nov 30, 1998
Sold by
Kssn Crnkshw J
Bought by
Keessen and Keessen Phelps
Purchase Details
Closed on
Nov 29, 1990
Sold by
Wachter Wachter J J and Wachter Mallehan D
Bought by
Brouwer Marilyn
Purchase Details
Closed on
Oct 21, 1985
Create a Home Valuation Report for This Property
The Home Valuation Report is an in-depth analysis detailing your home's value as well as a comparison with similar homes in the area
Home Values in the Area
Average Home Value in this Area
Purchase History
| Date | Buyer | Sale Price | Title Company |
|---|---|---|---|
| Broliwer Marilyn | -- | None Available | |
| Brouwer Marilyn | -- | None Available | |
| Brouwer Marilyn | -- | None Available | |
| Brouwer Winifred B | $135,000 | Metropolitan Title Company | |
| Keessen | $104,000 | -- | |
| Brouwer Marilyn | $76,000 | -- | |
| -- | $48,000 | -- |
Source: Public Records
Tax History Compared to Growth
Tax History
| Year | Tax Paid | Tax Assessment Tax Assessment Total Assessment is a certain percentage of the fair market value that is determined by local assessors to be the total taxable value of land and additions on the property. | Land | Improvement |
|---|---|---|---|---|
| 2025 | $1,907 | $145,300 | $0 | $0 |
| 2024 | $1,907 | $140,300 | $0 | $0 |
| 2023 | $1,827 | $122,300 | $0 | $0 |
| 2022 | $1,837 | $107,400 | $0 | $0 |
| 2021 | $1,796 | $97,500 | $0 | $0 |
| 2020 | $1,717 | $88,000 | $0 | $0 |
| 2019 | $1,737 | $80,300 | $0 | $0 |
| 2018 | $1,737 | $72,700 | $0 | $0 |
| 2017 | $1,691 | $63,400 | $0 | $0 |
| 2016 | $1,711 | $59,000 | $0 | $0 |
| 2015 | $1,591 | $59,000 | $0 | $0 |
| 2013 | -- | $0 | $0 | $0 |
Source: Public Records
Map
Nearby Homes
- 734 Deming St SE
- 703 Griswold St SE
- 706 Winchell St SE
- 2120 Linden Ave SE
- 900 Hazen St SE
- 624 Hazen St SE
- 2119 Linden Ave SE
- 2098 Linden Ave SE
- 2113 Linden Ave SE
- 2120 Willard Ave SE
- 2107 Linden Ave SE
- 2101 Linden Ave SE
- 2095 Linden Ave SE
- 2083 Linden Ave SE
- 2116 Willard Ave SE
- 2089 Linden Ave SE
- 2072 Linden Ave SE
- 2071 Linden Ave SE
- 2077 Linden Ave SE
- 2066 Linden Ave SE
- 824 S Ottillia St SE
- 812 S Ottillia St SE
- 830 S Ottillia St SE
- 817 Edna St SE
- 821 Edna St SE
- 813 S Ottillia St SE
- 813 Edna St SE
- 2244 Eastern Ave SE
- 2248 Eastern Ave SE
- 2240 Eastern Ave SE
- 2234 Eastern Ave SE
- 836 S Ottillia St SE
- 809 Edna St SE
- 808 N Ottillia St SE
- 829 S Ottillia St SE
- 2230 Eastern Ave SE
- 800 S Ottillia St SE
- 835 Edna St SE
- 803 Edna St SE
- 833 S Ottillia St SE