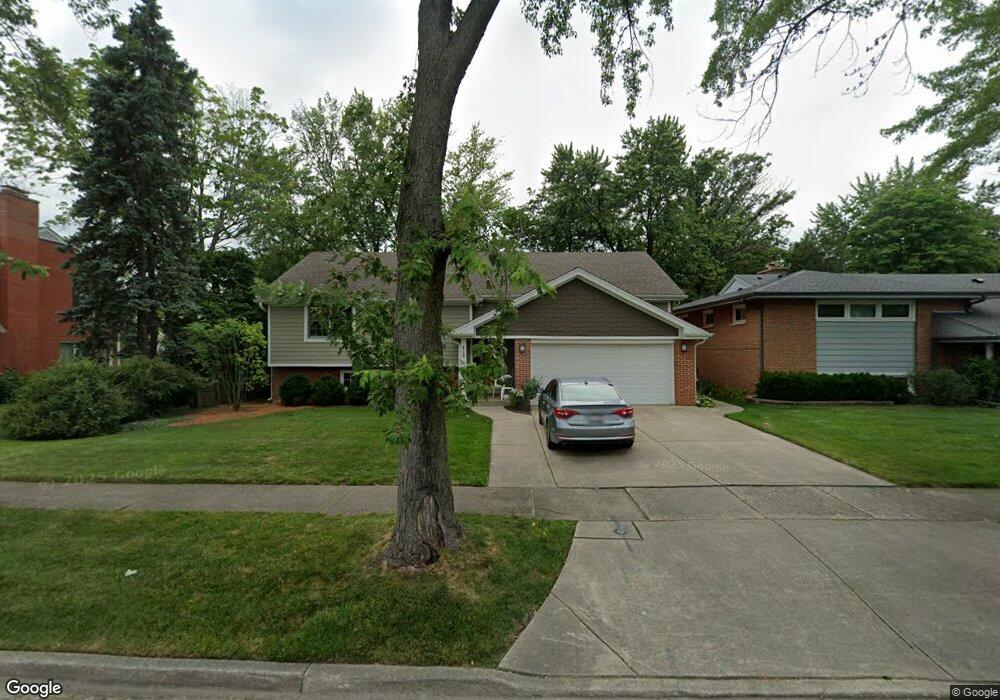
820 S Western Ave Park Ridge, IL 60068
Estimated Value: $685,000 - $813,160
4
Beds
3
Baths
2,387
Sq Ft
$318/Sq Ft
Est. Value
About This Home
This home is located at 820 S Western Ave, Park Ridge, IL 60068 and is currently estimated at $758,290, approximately $317 per square foot. 820 S Western Ave is a home located in Cook County with nearby schools including George Washington Elementary School, Lincoln Middle School, and Maine South High School.
Ownership History
Date
Name
Owned For
Owner Type
Purchase Details
Closed on
Mar 7, 2024
Sold by
Harrington Margaret B
Bought by
Margaret B Harrington Trust and Harrington
Current Estimated Value
Purchase Details
Closed on
Sep 14, 2015
Sold by
Harrington James D
Bought by
Harrington Margaret C
Purchase Details
Closed on
Oct 30, 2002
Sold by
Nannini Marie T
Bought by
Harrington James D and Harrington Margaret C
Home Financials for this Owner
Home Financials are based on the most recent Mortgage that was taken out on this home.
Original Mortgage
$432,000
Interest Rate
5.87%
Mortgage Type
Unknown
Purchase Details
Closed on
Nov 10, 1998
Sold by
Nannini Robert W and Nannini Marie T
Bought by
Nannini Marie T and Marie T Nannini Land Trust
Create a Home Valuation Report for This Property
The Home Valuation Report is an in-depth analysis detailing your home's value as well as a comparison with similar homes in the area
Home Values in the Area
Average Home Value in this Area
Purchase History
| Date | Buyer | Sale Price | Title Company |
|---|---|---|---|
| Margaret B Harrington Trust | -- | None Listed On Document | |
| Harrington Margaret C | -- | Attorney | |
| Harrington James D | $540,000 | Cti | |
| Harrington James D | $540,000 | Cti | |
| Nannini Marie T | -- | -- |
Source: Public Records
Mortgage History
| Date | Status | Borrower | Loan Amount |
|---|---|---|---|
| Previous Owner | Harrington James D | $432,000 |
Source: Public Records
Tax History Compared to Growth
Tax History
| Year | Tax Paid | Tax Assessment Tax Assessment Total Assessment is a certain percentage of the fair market value that is determined by local assessors to be the total taxable value of land and additions on the property. | Land | Improvement |
|---|---|---|---|---|
| 2024 | $15,208 | $62,000 | $13,464 | $48,536 |
| 2023 | $14,523 | $62,000 | $13,464 | $48,536 |
| 2022 | $14,523 | $62,000 | $13,464 | $48,536 |
| 2021 | $14,167 | $52,574 | $7,920 | $44,654 |
| 2020 | $14,449 | $52,574 | $7,920 | $44,654 |
| 2019 | $14,331 | $58,416 | $7,920 | $50,496 |
| 2018 | $11,788 | $44,629 | $6,930 | $37,699 |
| 2017 | $11,755 | $44,629 | $6,930 | $37,699 |
| 2016 | $11,560 | $44,629 | $6,930 | $37,699 |
| 2015 | $12,495 | $43,136 | $5,742 | $37,394 |
| 2014 | $12,265 | $43,136 | $5,742 | $37,394 |
| 2013 | $11,601 | $43,136 | $5,742 | $37,394 |
Source: Public Records
Map
Nearby Homes
- 929 S Aldine Ave
- 425 W Talcott Rd
- 516 Engel Blvd
- 600 S Greenwood Ave
- 1014 S Chester Ave
- 1219 S Western Ave
- 919 S Chester Ave
- 1016 Arthur St
- 1401 Park Ridge Blvd
- 428 S Clifton Ave
- 1116 S Cumberland Ave
- 820 W Talcott Rd
- 819 Albion Ave
- 901 S Cumberland Ave
- 2300 Windsor Mall Unit 1F
- 2300 Windsor Mall Unit 2E
- 414 S Dee Rd Unit 13
- 2500 Windsor Mall Unit 1J
- 316 S Fairview Ave
- 500 Thames Pkwy Unit 1F
- 816 S Western Ave
- 826 S Western Ave
- 812 S Western Ave
- 819 S Aldine Ave
- 817 S Aldine Ave
- 821 S Aldine Ave
- 808 S Western Ave
- 815 S Aldine Ave
- 830 S Western Ave
- 825 S Aldine Ave
- 815 S Western Ave
- 819 S Western Ave
- 811 S Western Ave
- 823 S Western Ave
- 811 S Aldine Ave
- 804 S Western Ave
- 831 S Aldine Ave
- 809 S Western Ave
- 827 S Western Ave
- 831 S Western Ave