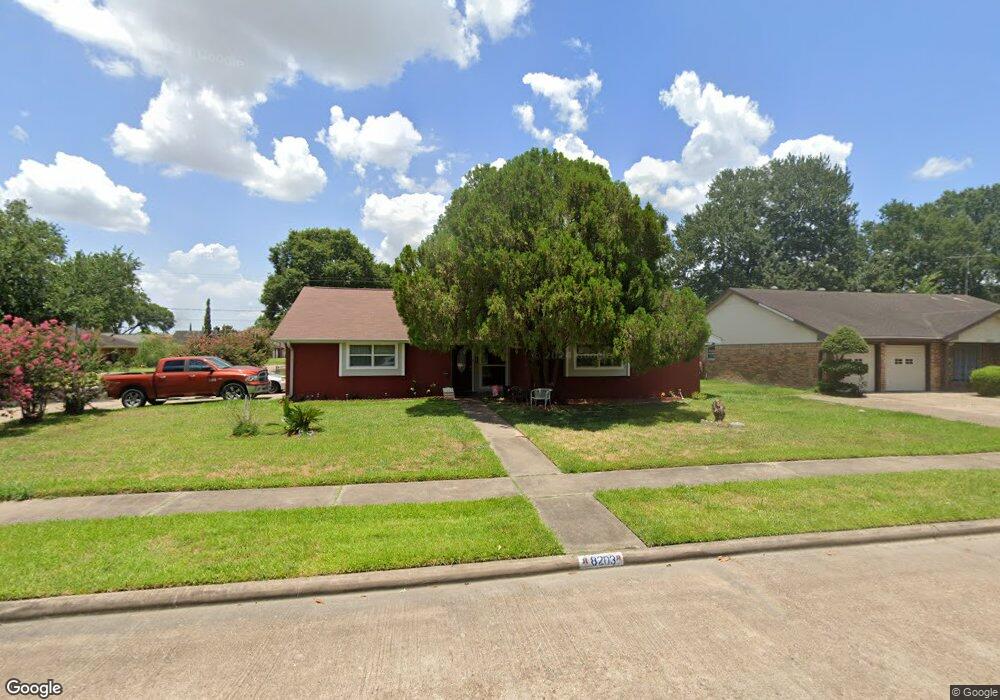
8203 Springtime Ln Houston, TX 77075
Greater Hobby Area NeighborhoodEstimated Value: $248,596 - $271,000
4
Beds
2
Baths
1,658
Sq Ft
$155/Sq Ft
Est. Value
About This Home
This home is located at 8203 Springtime Ln, Houston, TX 77075 and is currently estimated at $256,899, approximately $154 per square foot. 8203 Springtime Ln is a home located in Harris County with nearby schools including Mitchell Elementary School, Albert Thomas Middle School, and Ross Shaw Sterling Aviation High School.
Ownership History
Date
Name
Owned For
Owner Type
Purchase Details
Closed on
Aug 4, 2000
Sold by
Va
Bought by
Castillo Felipe T and Castillo Maria E
Current Estimated Value
Home Financials for this Owner
Home Financials are based on the most recent Mortgage that was taken out on this home.
Original Mortgage
$77,600
Outstanding Balance
$28,117
Interest Rate
8.21%
Estimated Equity
$228,782
Purchase Details
Closed on
Jan 4, 2000
Sold by
Homeside Lending Inc
Bought by
Va
Purchase Details
Closed on
Aug 31, 1995
Sold by
Thomas Damon C and Thomas Betty
Bought by
Green Charlie B and Green Versie
Home Financials for this Owner
Home Financials are based on the most recent Mortgage that was taken out on this home.
Original Mortgage
$63,860
Interest Rate
7.76%
Mortgage Type
Assumption
Create a Home Valuation Report for This Property
The Home Valuation Report is an in-depth analysis detailing your home's value as well as a comparison with similar homes in the area
Home Values in the Area
Average Home Value in this Area
Purchase History
| Date | Buyer | Sale Price | Title Company |
|---|---|---|---|
| Castillo Felipe T | -- | Southland Title Company | |
| Va | -- | -- | |
| Homeside Lending Inc | $63,710 | -- | |
| Green Charlie B | -- | Stewart Title |
Source: Public Records
Mortgage History
| Date | Status | Borrower | Loan Amount |
|---|---|---|---|
| Open | Castillo Felipe T | $77,600 | |
| Previous Owner | Green Charlie B | $63,860 |
Source: Public Records
Tax History Compared to Growth
Tax History
| Year | Tax Paid | Tax Assessment Tax Assessment Total Assessment is a certain percentage of the fair market value that is determined by local assessors to be the total taxable value of land and additions on the property. | Land | Improvement |
|---|---|---|---|---|
| 2025 | $2,186 | $257,557 | $39,875 | $217,682 |
| 2024 | $2,186 | $234,966 | $38,679 | $196,287 |
| 2023 | $2,186 | $234,966 | $38,679 | $196,287 |
| 2022 | $3,315 | $201,471 | $38,679 | $162,792 |
| 2021 | $3,189 | $178,323 | $27,848 | $150,475 |
| 2020 | $3,013 | $164,485 | $27,275 | $137,210 |
| 2019 | $2,862 | $139,953 | $26,701 | $113,252 |
| 2018 | $755 | $51,952 | $28,710 | $23,242 |
| 2017 | $2,481 | $102,818 | $28,710 | $74,108 |
| 2016 | $2,256 | $89,205 | $28,710 | $60,495 |
| 2015 | $1,367 | $86,066 | $28,710 | $57,356 |
| 2014 | $1,367 | $77,998 | $17,944 | $60,054 |
Source: Public Records
Map
Nearby Homes
- 8420 Fuqua St
- TBD Arrowhead Ln
- 10806 Tallow Briar
- 7851 Fuqua St
- 8612 Fuqua St
- 001 Fuqua St
- 8405 Folkstone Ln
- 8417 Folkstone Ln
- 8718 Black Cliff Ln
- 8615 Tartan Walk Ln
- 0 Leitz Rd
- 10815 Leitz Rd
- 8412 Peekskill Ln
- 8006 Hall Rd
- 8410 Saylynn Ln
- 10405 Gulf Meadows Dr
- 10809 Telephone Rd
- 11115 Opal Glen Ln
- 8614 Viera Ln
- 8428 Swiftwater Ln
- 8207 Springtime Ln
- 8202 Garden Parks Dr
- 8206 Garden Parks Dr
- 8131 Springtime Ln
- 8211 Springtime Ln
- 8202 Springtime Ln
- 8130 Garden Parks Dr
- 8210 Garden Parks Dr
- 8206 Springtime Ln
- 8127 Springtime Ln
- 8215 Springtime Ln
- 10902 Gulf Valley St
- 8210 Springtime Ln
- 8126 Garden Parks Dr
- 8214 Garden Parks Dr
- 8214 Springtime Ln
- 10906 Gulf Valley St
- 8123 Springtime Ln
- 8203 Gulfwood Ln
- 8203 Garden Parks Dr