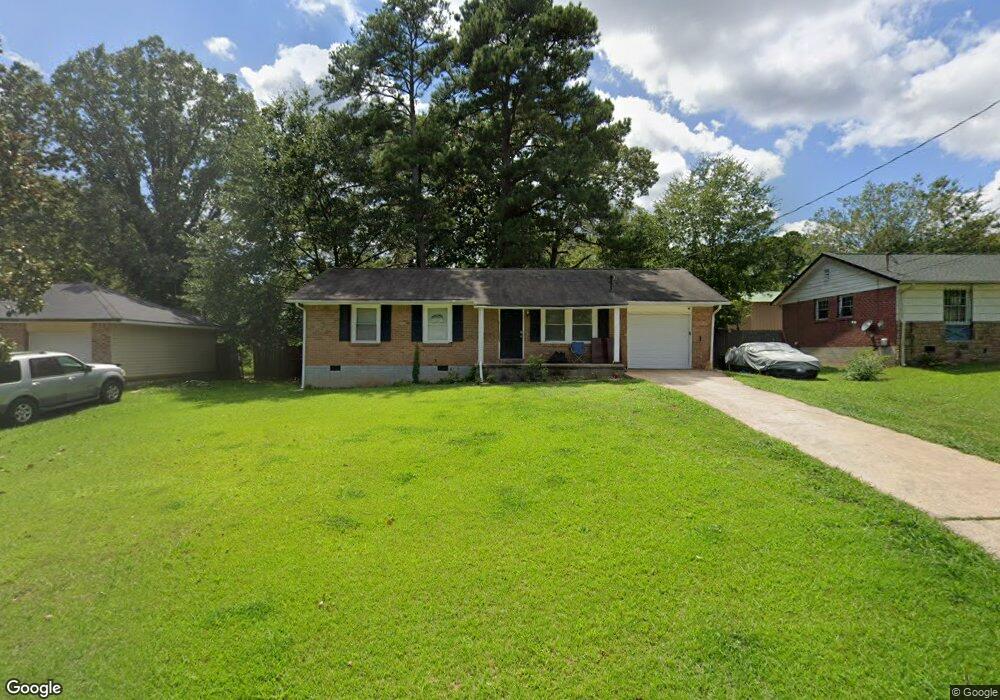
8203 Sussex Dr Jonesboro, GA 30238
Estimated Value: $184,162 - $257,000
3
Beds
2
Baths
1,473
Sq Ft
$142/Sq Ft
Est. Value
About This Home
This home is located at 8203 Sussex Dr, Jonesboro, GA 30238 and is currently estimated at $209,291, approximately $142 per square foot. 8203 Sussex Dr is a home located in Clayton County with nearby schools including Swint Elementary School, Kendrick Middle School, and Jonesboro High School.
Ownership History
Date
Name
Owned For
Owner Type
Purchase Details
Closed on
Apr 9, 2025
Sold by
Home Sfr Borrower Iii Llc
Bought by
Fyr Sfr Borrower Llc
Current Estimated Value
Purchase Details
Closed on
Jun 29, 2017
Sold by
Lhf 4 Assets Llc
Bought by
Home Sfr Borrower Iii Llc and C/O Altisource Asset Managemen
Purchase Details
Closed on
Mar 31, 2016
Sold by
American Residential Leasing Co Llc
Bought by
Lhf 4 Assets Llc
Purchase Details
Closed on
Dec 7, 2012
Sold by
Precise Crof Llc
Bought by
American Residential Leasing C
Purchase Details
Closed on
Sep 28, 2012
Sold by
Cao Assets Management Llc
Bought by
Precise Crof Llc
Purchase Details
Closed on
Apr 3, 2012
Sold by
Watts Dock
Bought by
Cao Assets Managements Llc
Purchase Details
Closed on
Sep 28, 2001
Sold by
Griffith Ben H and Griffith Donald R
Bought by
Watts Dock
Home Financials for this Owner
Home Financials are based on the most recent Mortgage that was taken out on this home.
Original Mortgage
$78,850
Interest Rate
6.74%
Mortgage Type
New Conventional
Create a Home Valuation Report for This Property
The Home Valuation Report is an in-depth analysis detailing your home's value as well as a comparison with similar homes in the area
Home Values in the Area
Average Home Value in this Area
Purchase History
| Date | Buyer | Sale Price | Title Company |
|---|---|---|---|
| Fyr Sfr Borrower Llc | -- | -- | |
| Home Sfr Borrower Iii Llc | $123,924 | -- | |
| Lhf 4 Assets Llc | $73,300 | -- | |
| American Residential Leasing C | $52,000 | -- | |
| Precise Crof Llc | $35,000 | -- | |
| Cao Assets Managements Llc | $18,400 | -- | |
| Watts Dock | $83,000 | -- |
Source: Public Records
Mortgage History
| Date | Status | Borrower | Loan Amount |
|---|---|---|---|
| Previous Owner | Watts Dock | $78,850 |
Source: Public Records
Tax History Compared to Growth
Tax History
| Year | Tax Paid | Tax Assessment Tax Assessment Total Assessment is a certain percentage of the fair market value that is determined by local assessors to be the total taxable value of land and additions on the property. | Land | Improvement |
|---|---|---|---|---|
| 2024 | $2,421 | $71,960 | $6,400 | $65,560 |
| 2023 | $2,652 | $72,480 | $6,400 | $66,080 |
| 2022 | $1,988 | $49,760 | $6,400 | $43,360 |
| 2021 | $1,596 | $39,520 | $6,400 | $33,120 |
| 2020 | $1,261 | $30,651 | $6,400 | $24,251 |
| 2019 | $1,191 | $28,477 | $4,800 | $23,677 |
| 2018 | $1,059 | $25,228 | $4,800 | $20,428 |
| 2017 | $842 | $19,830 | $4,800 | $15,030 |
| 2016 | $705 | $16,470 | $4,800 | $11,670 |
| 2015 | $702 | $0 | $0 | $0 |
| 2014 | $706 | $16,859 | $5,600 | $11,259 |
Source: Public Records
Map
Nearby Homes
- 332 W Downing Ct
- 8236 Tudor Dr
- 8154 Tudor Dr
- 324 Cynthia Ct
- 8265 Attleboro Dr
- 636 North Ave Unit 11A
- 636 North Ave Unit 5A
- 46 Royce Dr
- 55 Royce Dr Unit 5
- 7994 Devonshire Dr
- 8117 Attleboro Dr
- 45 Royce Dr
- 8207 Dunellen Ln
- 37 Royce Dr Unit LOT 21
- 8344 Dunellen Ln
- 8356 Dunellen Ln
- 8511 Pineland Dr
- 602 Dixon Rd
- 42 Skylark Ln Unit 1
- 20 Skylark Ln
- 8203 Sussex Dr
- 8195 Sussex Dr Unit 2
- 8209 Sussex Dr
- 8218 Eton Ct Unit 2
- 8189 Sussex Dr Unit 2
- 8224 Eton Ct
- 8215 Sussex Dr
- 8210 Eton Ct
- 8198 Sussex Dr Unit 2
- 8230 Eton Ct
- 8202 Eton Ct
- 8181 Sussex Dr
- 8218 Sussex Dr
- 8190 Sussex Dr Unit 2
- 8219 Sussex Dr Unit 2
- 8196 Eton Ct
- 8182 Sussex Dr
- 311 W Downing Ct
- 8173 Sussex Dr
- 8234 Eton Ct Unit 2