8205 Rustic Dr Chardon, OH 44024
Estimated Value: $405,000 - $489,000
3
Beds
3
Baths
1,064
Sq Ft
$412/Sq Ft
Est. Value
About This Home
This home is located at 8205 Rustic Dr, Chardon, OH 44024 and is currently estimated at $438,280, approximately $411 per square foot. 8205 Rustic Dr is a home located in Lake County with nearby schools including Henry F. Lamuth Middle School and Riverside Junior/Senior High School.
Ownership History
Date
Name
Owned For
Owner Type
Purchase Details
Closed on
Sep 27, 2001
Sold by
Cianfaglione Andrew W and Cianfaglione Angie
Bought by
Bennett David J and Bennett Victoria A
Current Estimated Value
Home Financials for this Owner
Home Financials are based on the most recent Mortgage that was taken out on this home.
Original Mortgage
$196,200
Outstanding Balance
$73,808
Interest Rate
6.97%
Estimated Equity
$364,472
Purchase Details
Closed on
Jun 16, 1999
Sold by
Andrew Cianfaglione Builders Inc
Bought by
Cianfaglione Andrew W
Home Financials for this Owner
Home Financials are based on the most recent Mortgage that was taken out on this home.
Original Mortgage
$15,900
Interest Rate
6%
Mortgage Type
Seller Take Back
Purchase Details
Closed on
Jan 1, 1990
Bought by
Andrew Cianfaglione
Create a Home Valuation Report for This Property
The Home Valuation Report is an in-depth analysis detailing your home's value as well as a comparison with similar homes in the area
Purchase History
| Date | Buyer | Sale Price | Title Company |
|---|---|---|---|
| Bennett David J | $218,000 | Midland Title Security Inc | |
| Cianfaglione Andrew W | $49,900 | Midland Title Security Inc | |
| Andrew Cianfaglione | -- | -- |
Source: Public Records
Mortgage History
| Date | Status | Borrower | Loan Amount |
|---|---|---|---|
| Open | Bennett David J | $196,200 | |
| Closed | Cianfaglione Andrew W | $15,900 |
Source: Public Records
Tax History
| Year | Tax Paid | Tax Assessment Tax Assessment Total Assessment is a certain percentage of the fair market value that is determined by local assessors to be the total taxable value of land and additions on the property. | Land | Improvement |
|---|---|---|---|---|
| 2025 | -- | $132,610 | $22,670 | $109,940 |
| 2024 | -- | $132,610 | $22,670 | $109,940 |
| 2023 | $9,275 | $94,500 | $15,450 | $79,050 |
| 2022 | $4,981 | $94,500 | $15,450 | $79,050 |
| 2021 | $4,998 | $94,500 | $15,450 | $79,050 |
| 2020 | $4,719 | $78,760 | $12,880 | $65,880 |
| 2019 | $4,759 | $78,760 | $12,880 | $65,880 |
| 2018 | $4,589 | $83,850 | $16,020 | $67,830 |
| 2017 | $5,132 | $83,850 | $16,020 | $67,830 |
| 2016 | $4,727 | $83,850 | $16,020 | $67,830 |
| 2015 | $4,476 | $83,850 | $16,020 | $67,830 |
| 2014 | $4,557 | $83,850 | $16,020 | $67,830 |
| 2013 | $4,481 | $83,850 | $16,020 | $67,830 |
Source: Public Records
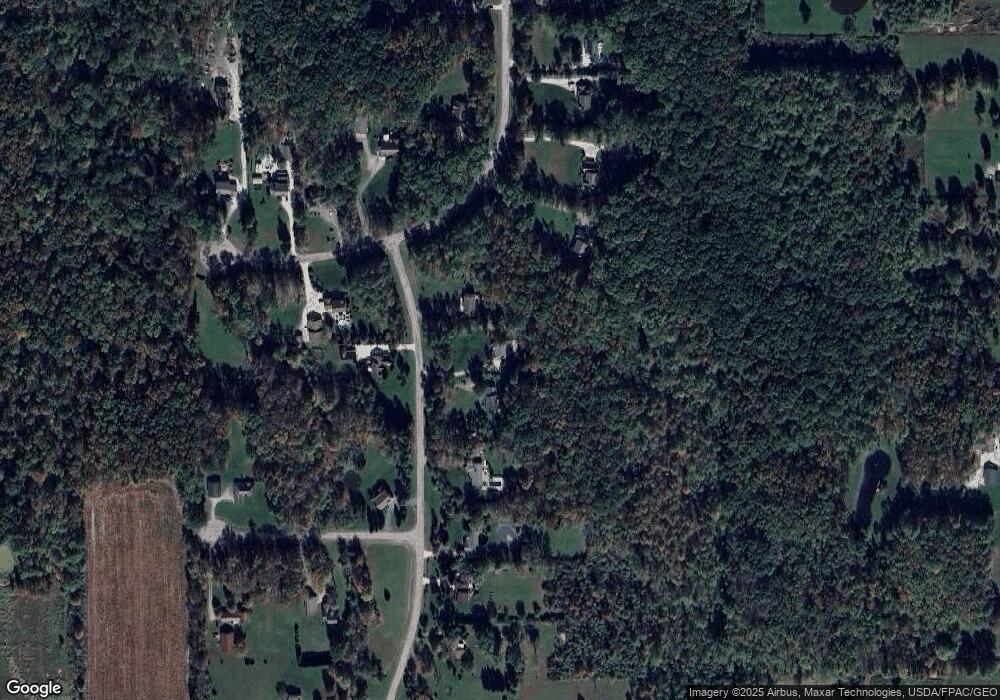
Map
Nearby Homes
- 7857 Lester Dr
- 7771 Lester Dr
- 13849 Painesville Warren Rd
- 8892 Brakeman Rd
- 14700 Rock Creek Rd
- 9165 Trish Ln
- 15744 Rock Creek Rd
- 12567 Girdled Rd
- V/L Leroy Center Rd
- 14940 Gar Hwy
- 14895 Gar Hwy
- V/L 4 Painesville Warren Rd
- V/L 5 Painesville Warren Rd
- V/L 2 Leroy Center Rd
- 13537 Shirley Dr
- 9419 Robinson Rd
- 9455 Robinson Rd
- 12000 Concord Hambden Rd
- 13149 Gar Hwy
- 10360 Sawmill Dr
- 8221 Rustic Dr
- 8185 Rustic Dr
- 8171 Autumn Dr
- 8235 Rustic Dr
- 8210 Rustic Dr
- 8151 Autumn Dr
- 8261 Rustic Dr
- 13850 Autumn Dr
- 8240 Rustic Dr
- S/L 30 Autumn Dr
- 8275 Rustic Dr
- 13883 Autumn Dr
- 0 Rustic Dr
- 13851 Autumn Dr
- 13863 Autumn Dr
- 8135 Autumn Dr
- 13831 Autumn Dr
- 8291 Rustic Dr
- 13823 Spring Ct
- 8121 Autumn Dr
Your Personal Tour Guide
Ask me questions while you tour the home.