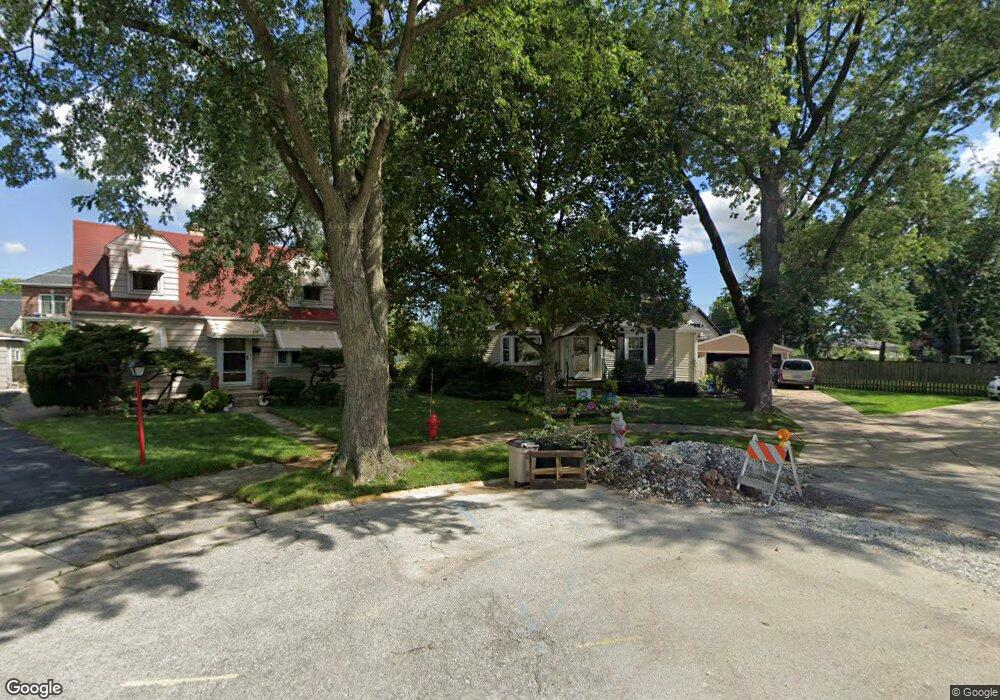
8205 W Ainslie St Norridge, IL 60706
Estimated Value: $421,000 - $477,000
3
Beds
3
Baths
1,702
Sq Ft
$265/Sq Ft
Est. Value
About This Home
This home is located at 8205 W Ainslie St, Norridge, IL 60706 and is currently estimated at $451,805, approximately $265 per square foot. 8205 W Ainslie St is a home located in Cook County with nearby schools including J Leigh Elementary School, Ridgewood Community High School, and St Eugene School.
Ownership History
Date
Name
Owned For
Owner Type
Purchase Details
Closed on
Apr 25, 2022
Sold by
Witkowski John L and Witkowski Noreen A
Bought by
Witkowski John L and Witkowski Noreen A
Current Estimated Value
Purchase Details
Closed on
Apr 20, 2022
Sold by
Witkowski John L and Witkowski Noreen A
Bought by
Joint Declaration Of Trust and Witkowski Noreen A
Purchase Details
Closed on
Jul 31, 1998
Sold by
Mugnaini Deborah
Bought by
Witkowski John L and Witkowski Noreen A
Home Financials for this Owner
Home Financials are based on the most recent Mortgage that was taken out on this home.
Original Mortgage
$124,500
Interest Rate
7.07%
Purchase Details
Closed on
Jan 30, 1996
Sold by
Mugnaini Joseph G
Bought by
Mugnaini Deborah E
Purchase Details
Closed on
Nov 1, 1995
Sold by
Mugnaini Joseph G
Bought by
Mugnaini Deborah Elaine
Home Financials for this Owner
Home Financials are based on the most recent Mortgage that was taken out on this home.
Original Mortgage
$120,000
Interest Rate
6.87%
Create a Home Valuation Report for This Property
The Home Valuation Report is an in-depth analysis detailing your home's value as well as a comparison with similar homes in the area
Home Values in the Area
Average Home Value in this Area
Purchase History
| Date | Buyer | Sale Price | Title Company |
|---|---|---|---|
| Witkowski John L | -- | -- | |
| Joint Declaration Of Trust | -- | None Listed On Document | |
| Witkowski John L | $214,500 | -- | |
| Mugnaini Deborah E | -- | -- | |
| Mugnaini Deborah Elaine | -- | -- |
Source: Public Records
Mortgage History
| Date | Status | Borrower | Loan Amount |
|---|---|---|---|
| Previous Owner | Witkowski John L | $124,500 | |
| Previous Owner | Mugnaini Deborah Elaine | $120,000 |
Source: Public Records
Tax History Compared to Growth
Tax History
| Year | Tax Paid | Tax Assessment Tax Assessment Total Assessment is a certain percentage of the fair market value that is determined by local assessors to be the total taxable value of land and additions on the property. | Land | Improvement |
|---|---|---|---|---|
| 2024 | $5,442 | $26,931 | $9,230 | $17,701 |
| 2023 | $5,283 | $26,931 | $9,230 | $17,701 |
| 2022 | $5,283 | $26,931 | $9,230 | $17,701 |
| 2021 | $5,944 | $26,700 | $8,165 | $18,535 |
| 2020 | $6,366 | $28,780 | $8,165 | $20,615 |
| 2019 | $6,347 | $32,301 | $8,165 | $24,136 |
| 2018 | $5,028 | $23,118 | $6,745 | $16,373 |
| 2017 | $4,919 | $23,118 | $6,745 | $16,373 |
| 2016 | $5,418 | $25,571 | $6,745 | $18,826 |
| 2015 | $3,936 | $18,079 | $5,857 | $12,222 |
| 2014 | $3,891 | $18,079 | $5,857 | $12,222 |
| 2013 | $3,797 | $18,079 | $5,857 | $12,222 |
Source: Public Records
Map
Nearby Homes
- 4846 N Crescent Ave
- 8268 W Lawrence Ave
- 8025 W Giddings St
- 8200 W Eastwood Ave
- 8024 W Charmaine Rd
- 4617 N Canfield Ave
- 4623 N Chester Ave Unit 110W
- 4624 N Commons Dr Unit 405E
- 4624 N Commons Dr Unit 111E
- 4600 N Cumberland Ave Unit 314
- 8500 W Carmen Ave
- 8517 W Carmen Ave
- 8423 W Wilson Ave
- 5134 N Mission Dr
- 5161 N Moreland Ave
- 8542 W Winnemac Ave
- 4615 N Maria Ct
- 4621 N Anthon Ave
- 4937 N Ozanam Ave
- 4621 N Ozanam Ave
- 8215 W Ainslie St
- 8212 W Ainslie St
- 4846 N Prospect Ave
- 4850 N Prospect Ave
- 4842 N Prospect Ave
- 8225 W Ainslie St
- 8206 W Gunnison St
- 4900 N Prospect Ave
- 8220 W Ainslie St
- 8216 W Gunnison St
- 4838 N Prospect Ave
- 8228 W Ainslie St
- 4906 N Prospect Ave
- 8226 W Gunnison St
- 8237 W Ainslie St
- 8215 W Strong St
- 8236 W Ainslie St
- 4834 N Prospect Ave
- 4912 N Prospect Ave
- 4850 N Pittsburgh Ave