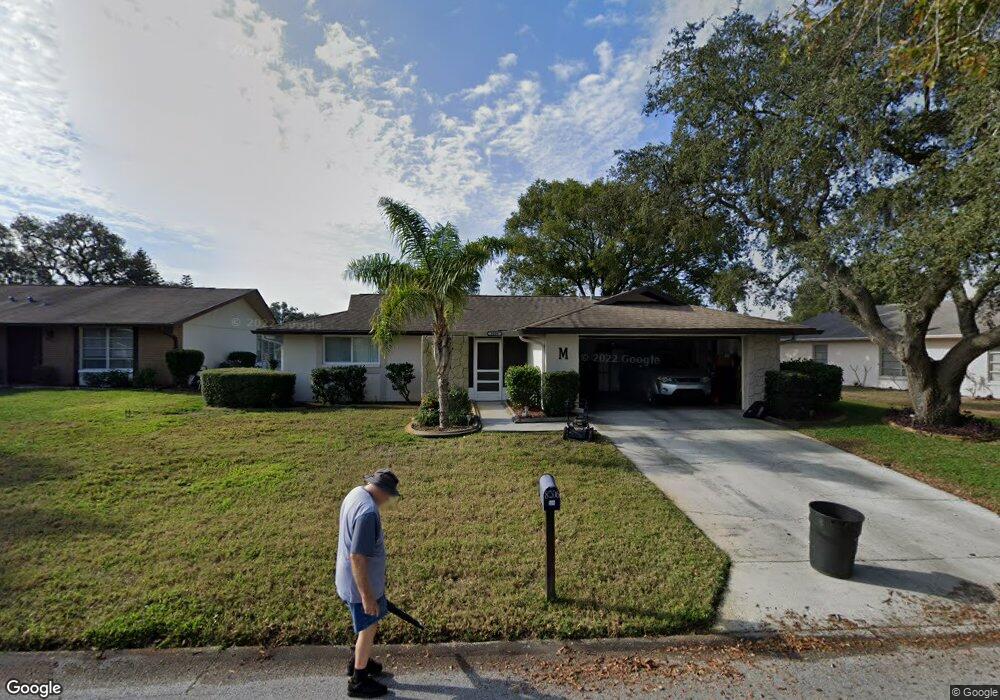
8206 Habra Dr Unit 3 Port Richey, FL 34668
Timber Oaks NeighborhoodEstimated Value: $210,000 - $244,000
2
Beds
2
Baths
1,374
Sq Ft
$164/Sq Ft
Est. Value
About This Home
This home is located at 8206 Habra Dr Unit 3, Port Richey, FL 34668 and is currently estimated at $225,984, approximately $164 per square foot. 8206 Habra Dr Unit 3 is a home located in Pasco County with nearby schools including Schrader Elementary School, Bayonet Point Middle School, and Fivay High School.
Ownership History
Date
Name
Owned For
Owner Type
Purchase Details
Closed on
Sep 7, 2011
Sold by
Workforce Housing Ventures Inc
Bought by
Martilik Stanley A and Martilik Joan
Current Estimated Value
Home Financials for this Owner
Home Financials are based on the most recent Mortgage that was taken out on this home.
Original Mortgage
$57,000
Outstanding Balance
$39,570
Interest Rate
4.55%
Mortgage Type
FHA
Estimated Equity
$186,414
Purchase Details
Closed on
Jan 21, 2010
Sold by
Fannie Mae
Bought by
Workforce Housing Ventures Inc
Purchase Details
Closed on
Oct 2, 2009
Sold by
Clark Joan B
Bought by
Fannie Mae and Federal National Mortgage Association
Purchase Details
Closed on
Feb 11, 2008
Sold by
Clark Frederick P and Clark Joan B
Bought by
Clark Joan B and Clark Frederick P
Purchase Details
Closed on
Jun 21, 2001
Sold by
Farley Katherine C
Bought by
Clark Frederick P and Clark Joan B
Create a Home Valuation Report for This Property
The Home Valuation Report is an in-depth analysis detailing your home's value as well as a comparison with similar homes in the area
Home Values in the Area
Average Home Value in this Area
Purchase History
| Date | Buyer | Sale Price | Title Company |
|---|---|---|---|
| Martilik Stanley A | $82,500 | Meridian Title Company Inc | |
| Workforce Housing Ventures Inc | $68,900 | Keystone Title Agency Inc | |
| Fannie Mae | $103,100 | Attorney | |
| Clark Joan B | -- | None Available | |
| Clark Frederick P | $55,800 | -- |
Source: Public Records
Mortgage History
| Date | Status | Borrower | Loan Amount |
|---|---|---|---|
| Open | Martilik Stanley A | $57,000 | |
| Previous Owner | Clark Frederick P | $50,000 | |
| Previous Owner | Clark Frederick P | $23,066 |
Source: Public Records
Tax History Compared to Growth
Tax History
| Year | Tax Paid | Tax Assessment Tax Assessment Total Assessment is a certain percentage of the fair market value that is determined by local assessors to be the total taxable value of land and additions on the property. | Land | Improvement |
|---|---|---|---|---|
| 2025 | $829 | $69,780 | -- | -- |
| 2024 | $829 | $67,820 | -- | -- |
| 2023 | $810 | $65,850 | $29,211 | $36,639 |
| 2022 | $812 | $63,940 | $0 | $0 |
| 2021 | $804 | $62,080 | $21,912 | $40,168 |
| 2020 | $794 | $61,230 | $12,912 | $48,318 |
| 2019 | $785 | $59,860 | $0 | $0 |
| 2018 | $723 | $58,753 | $0 | $0 |
| 2017 | $726 | $58,753 | $0 | $0 |
| 2016 | $684 | $56,361 | $0 | $0 |
| 2015 | $631 | $55,969 | $0 | $0 |
| 2014 | $611 | $59,949 | $12,552 | $47,397 |
Source: Public Records
Map
Nearby Homes
- 10819 Los Santos Dr
- 8140 San Felipe Ct
- 10800 Teer Ln
- 10803 Hachita Dr
- 10812 Teer Ln
- 8345 Elgin Dr
- 10619 Mira Vista Dr
- 8030 San Bernardino Dr
- 8040 Pasadena Dr
- 10715 Footprint Ln
- 7931 Bracken Dr
- 8101 Casuarina Dr
- 10521 Mira Vista Dr
- 10610 Mosquero Dr
- 10531 Meadow Hill Dr
- 8215 Autumn Oak Ave
- 11120 Carriage Hill Dr Unit 1
- 10824 Oldham Rd
- 11015 Linkside Dr
- 7919 Tropicana Dr
- 8210 Habra Dr
- 10806 Los Santos Dr
- 10800 Los Santos Dr
- 8211 San Felipe Ct
- 8216 Habra Dr
- 8211 Habra Dr
- 10734 Los Santos Dr
- 8215 Habra Dr
- 10816 Los Santos Dr
- 8215 San Felipe Ct
- 10730 Los Santos Dr
- 8220 Habra Dr
- 8221 Habra Dr
- 10807 Los Santos Dr
- 8221 San Felipe Ct
- 8214 Palma Del Rio Dr
- 10803 Los Santos Dr Unit 3
- 10811 Los Santos Dr
- 10822 Los Santos Dr
- 8220 Palma Del Rio Dr