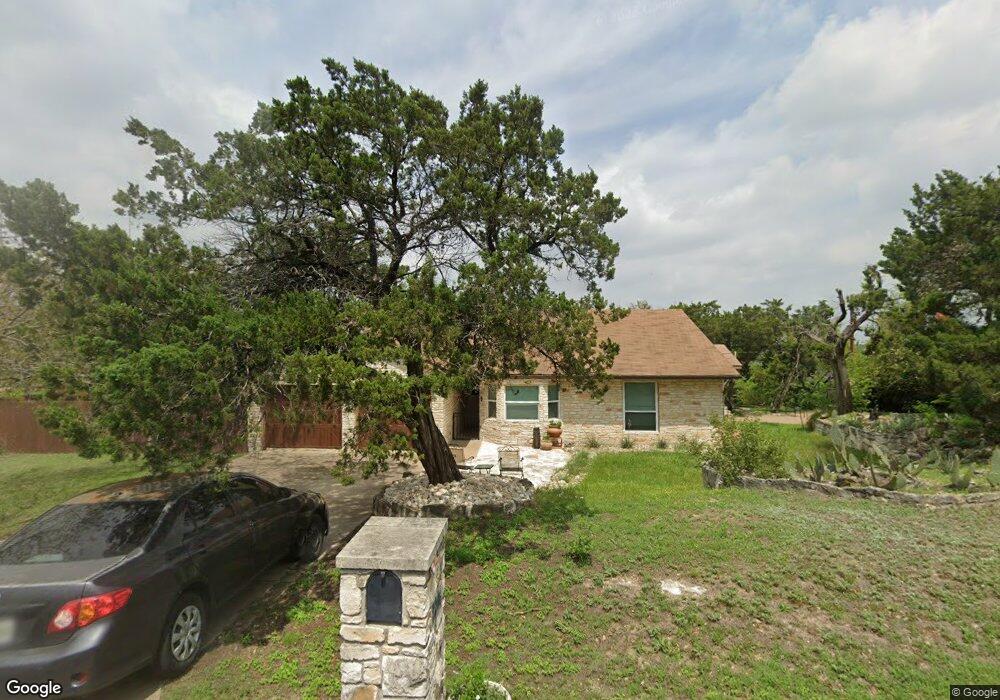
8206 Little Deer Crossing Austin, TX 78736
West Oak Hill NeighborhoodEstimated Value: $564,000 - $669,000
--
Bed
5
Baths
2,634
Sq Ft
$237/Sq Ft
Est. Value
About This Home
This home is located at 8206 Little Deer Crossing, Austin, TX 78736 and is currently estimated at $624,657, approximately $237 per square foot. 8206 Little Deer Crossing is a home located in Travis County with nearby schools including Patton Elementary School, Small Middle School, and James Bowie High School.
Ownership History
Date
Name
Owned For
Owner Type
Purchase Details
Closed on
Dec 28, 2018
Sold by
Vendetti Michele N and Vendetti Brian K
Bought by
Burke Christopher James and Mckinlay Kimberlee Ann
Current Estimated Value
Home Financials for this Owner
Home Financials are based on the most recent Mortgage that was taken out on this home.
Original Mortgage
$356,000
Outstanding Balance
$314,873
Interest Rate
4.9%
Mortgage Type
New Conventional
Estimated Equity
$309,784
Purchase Details
Closed on
Jun 6, 2008
Sold by
Vendetti Brian K
Bought by
Vendetti Michele N
Purchase Details
Closed on
Dec 22, 1998
Sold by
Baker Gary A and Baker Kelly L
Bought by
Vendetti Brian K
Home Financials for this Owner
Home Financials are based on the most recent Mortgage that was taken out on this home.
Original Mortgage
$126,350
Interest Rate
6.74%
Mortgage Type
Purchase Money Mortgage
Create a Home Valuation Report for This Property
The Home Valuation Report is an in-depth analysis detailing your home's value as well as a comparison with similar homes in the area
Home Values in the Area
Average Home Value in this Area
Purchase History
| Date | Buyer | Sale Price | Title Company |
|---|---|---|---|
| Burke Christopher James | -- | First American Title | |
| Vendetti Michele N | -- | None Available | |
| Vendetti Brian K | -- | Commonwealth Land Title |
Source: Public Records
Mortgage History
| Date | Status | Borrower | Loan Amount |
|---|---|---|---|
| Open | Burke Christopher James | $356,000 | |
| Previous Owner | Vendetti Brian K | $126,350 |
Source: Public Records
Tax History Compared to Growth
Tax History
| Year | Tax Paid | Tax Assessment Tax Assessment Total Assessment is a certain percentage of the fair market value that is determined by local assessors to be the total taxable value of land and additions on the property. | Land | Improvement |
|---|---|---|---|---|
| 2025 | $12,070 | $617,911 | $246,413 | $371,498 |
| 2023 | $13,848 | $765,377 | $144,000 | $621,377 |
| 2022 | $14,955 | $757,259 | $132,000 | $625,259 |
| 2021 | $11,078 | $508,942 | $132,000 | $376,942 |
| 2020 | $9,145 | $426,381 | $132,000 | $294,381 |
| 2018 | $8,265 | $373,325 | $132,000 | $241,325 |
| 2017 | $7,638 | $342,498 | $88,000 | $254,964 |
| 2016 | $6,944 | $311,362 | $88,000 | $256,537 |
| 2015 | $5,636 | $283,056 | $42,000 | $274,587 |
| 2014 | $5,636 | $257,324 | $0 | $0 |
Source: Public Records
Map
Nearby Homes
- 8005 Red Willow Dr
- 7008 Chinook Dr
- 6718 Silvermine Dr Unit 903
- 6718 Silvermine Dr Unit 804
- 7010 Harvest Trail Dr
- 8818 Moccasin Path
- Plan 2070 at Creekside at Estancia
- Plan 2245 at Creekside at Estancia
- Plan 1888 at Scenic Pass
- Plan 2881 at Scenic Pass
- Plan 1675 at Scenic Pass
- Plan 2586 at Creekside at Estancia
- Plan 1908 Modeled at Creekside at Estancia
- Plan 2469 at Scenic Pass
- Plan 2527 Modeled at Creekside at Estancia
- Plan 2502 at Scenic Pass
- Plan 1315 at Creekside at Estancia
- Plan 1548 at Creekside at Estancia
- Plan 1780 at Creekside at Estancia
- Plan 1491 at Scenic Pass
- 7103 Silvermine Dr
- 7121 Silvermine Dr
- 7118 Silvermine Dr
- 8201 Little Deer Crossing
- 8110 Little Deer Crossing
- 7005 Silvermine Dr
- 7120 Silvermine Dr
- 8300 Moccasin Path
- 7123 Silvermine Dr
- 8109 Pinto Path
- 7001 Silvermine Dr
- 8200 Red Willow Dr
- 7004 Silvermine Dr
- 8202 Red Willow Dr
- 8205 Mescalero Dr
- 8110 Pinto Path
- 8302 Moccasin Path
- 8110 Red Willow Dr
- 8105 Mescalero Dr
- 8107 Pinto Path