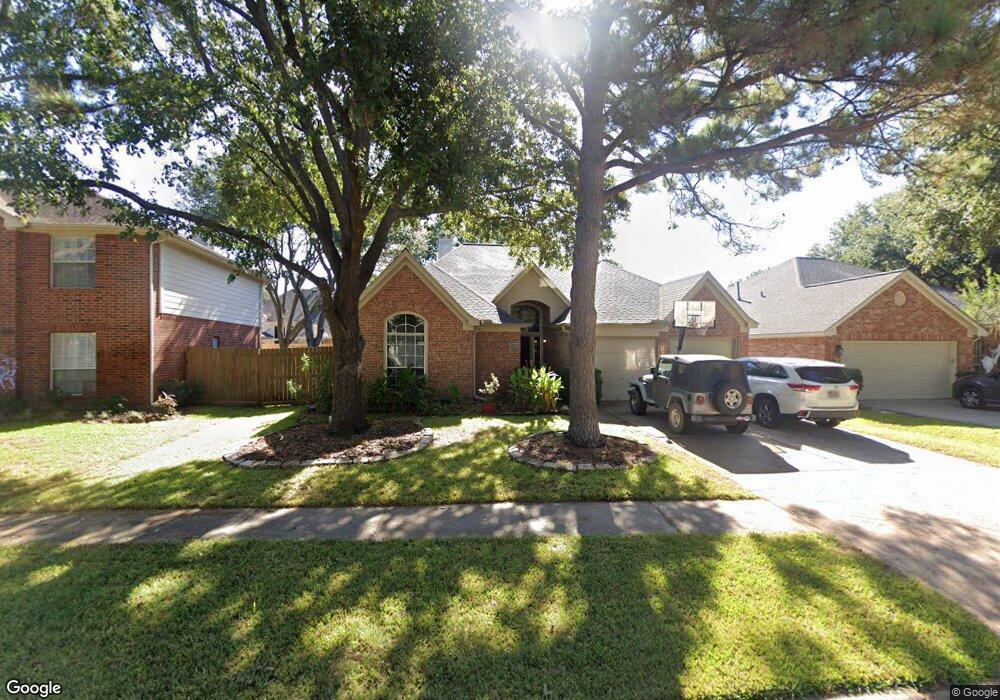
8206 Polished Stone Cir Houston, TX 77095
Copperfield NeighborhoodEstimated Value: $325,000 - $360,000
3
Beds
2
Baths
2,403
Sq Ft
$142/Sq Ft
Est. Value
About This Home
This home is located at 8206 Polished Stone Cir, Houston, TX 77095 and is currently estimated at $342,146, approximately $142 per square foot. 8206 Polished Stone Cir is a home located in Harris County with nearby schools including Birkes Elementary School, Aragon Middle School, and Langham Creek High School.
Ownership History
Date
Name
Owned For
Owner Type
Purchase Details
Closed on
Dec 28, 2004
Sold by
Spann Gary D
Bought by
Spann Gary D and Spann Peggy
Current Estimated Value
Home Financials for this Owner
Home Financials are based on the most recent Mortgage that was taken out on this home.
Original Mortgage
$140,800
Outstanding Balance
$70,711
Interest Rate
5.67%
Mortgage Type
Stand Alone First
Estimated Equity
$271,435
Purchase Details
Closed on
Nov 25, 1996
Sold by
Perry Homes
Bought by
Spann Gary D
Home Financials for this Owner
Home Financials are based on the most recent Mortgage that was taken out on this home.
Original Mortgage
$92,500
Interest Rate
7.85%
Mortgage Type
Purchase Money Mortgage
Create a Home Valuation Report for This Property
The Home Valuation Report is an in-depth analysis detailing your home's value as well as a comparison with similar homes in the area
Home Values in the Area
Average Home Value in this Area
Purchase History
| Date | Buyer | Sale Price | Title Company |
|---|---|---|---|
| Spann Gary D | -- | -- | |
| Spann Gary D | -- | Chicago Title Insurance Co |
Source: Public Records
Mortgage History
| Date | Status | Borrower | Loan Amount |
|---|---|---|---|
| Open | Spann Gary D | $140,800 | |
| Closed | Spann Gary D | $92,500 |
Source: Public Records
Tax History Compared to Growth
Tax History
| Year | Tax Paid | Tax Assessment Tax Assessment Total Assessment is a certain percentage of the fair market value that is determined by local assessors to be the total taxable value of land and additions on the property. | Land | Improvement |
|---|---|---|---|---|
| 2025 | $1,855 | $334,117 | $68,655 | $265,462 |
| 2024 | $1,855 | $345,661 | $68,655 | $277,006 |
| 2023 | $1,855 | $341,811 | $68,655 | $273,156 |
| 2022 | $7,060 | $316,209 | $48,990 | $267,219 |
| 2021 | $6,799 | $242,750 | $48,990 | $193,760 |
| 2020 | $6,433 | $223,025 | $40,710 | $182,315 |
| 2019 | $6,549 | $220,826 | $34,500 | $186,326 |
| 2018 | $1,107 | $221,003 | $34,500 | $186,503 |
| 2017 | $6,578 | $221,003 | $34,500 | $186,503 |
| 2016 | $6,500 | $221,003 | $34,500 | $186,503 |
| 2015 | $2,844 | $207,441 | $34,500 | $172,941 |
| 2014 | $2,844 | $180,499 | $27,600 | $152,899 |
Source: Public Records
Map
Nearby Homes
- 16335 Drystone Ln
- 8426 Laurel Trails Dr
- 8550 Waiting Spring Ln
- 16510 Wellers Way
- 16215 Wemyss Bay Rd
- 16403 Torry View Terrace
- 16426 Torry View Terrace
- 16315 Battlecreek Dr
- 16215 Cairngorm Ave
- 8619 Arranmore Ln
- 16511 Crystal View Ct
- 16319 Chimneystone Dr
- 16114 Kintyre Point Rd
- 8550 Sparkling Springs Dr
- 8526 Hot Springs Dr
- 8306 Lake Crystal Dr
- 16026 Autumn Falls Ln
- 15954 Oak Mountain Dr
- 16611 Gentle Stone Dr
- 15918 Pinyon Creek Dr
- 8210 Polished Stone Cir
- 8202 Polished Stone Cir
- 8214 Polished Stone Cir
- 8207 Broken Timber Way
- 8215 Broken Timber Way
- 8219 Broken Timber Way
- 8207 Polished Stone Cir
- 8218 Polished Stone Cir
- 8203 Polished Stone Cir
- 8211 Polished Stone Cir
- 8215 Polished Stone Cir
- 16215 Shining Rock Ln
- 16219 Shining Rock Ln
- 8223 Broken Timber Way
- 16211 Shining Rock Ln
- 16223 Shining Rock Ln
- 8222 Polished Stone Cir
- 8219 Polished Stone Cir
- 16207 Shining Rock Ln
- 16303 Shining Rock Ln