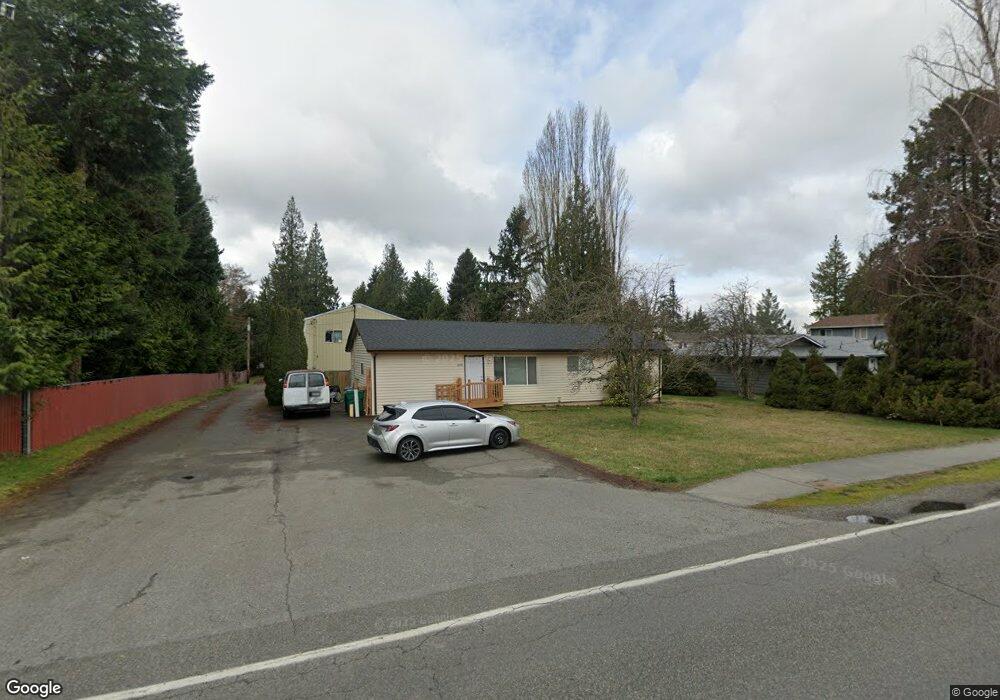
8208 44th Ave W Mukilteo, WA 98275
Estimated Value: $534,000 - $711,000
3
Beds
1
Bath
1,352
Sq Ft
$464/Sq Ft
Est. Value
About This Home
This home is located at 8208 44th Ave W, Mukilteo, WA 98275 and is currently estimated at $627,234, approximately $463 per square foot. 8208 44th Ave W is a home located in Snohomish County with nearby schools including Mukilteo Elementary School, Olympic View Middle School, and Kamiak High School.
Ownership History
Date
Name
Owned For
Owner Type
Purchase Details
Closed on
Jan 31, 2017
Sold by
Gill Helen L
Bought by
Randhawa Gerveer and Grewal Kamaljit
Current Estimated Value
Purchase Details
Closed on
Jul 29, 2016
Sold by
Mukilteo Helen L
Bought by
Randhawa Gurveer and Grewel Kamaljit
Purchase Details
Closed on
Apr 29, 2016
Sold by
Eastside Funding Llc
Bought by
Randhawa Gurveer and Grewal Kamaljit
Purchase Details
Closed on
Mar 9, 2007
Sold by
Gell Helen L
Bought by
Gell Helen L
Home Financials for this Owner
Home Financials are based on the most recent Mortgage that was taken out on this home.
Original Mortgage
$544,185
Interest Rate
5.92%
Mortgage Type
Reverse Mortgage Home Equity Conversion Mortgage
Purchase Details
Closed on
Apr 23, 2003
Sold by
Gell Helen L
Bought by
Gell Helen L
Create a Home Valuation Report for This Property
The Home Valuation Report is an in-depth analysis detailing your home's value as well as a comparison with similar homes in the area
Home Values in the Area
Average Home Value in this Area
Purchase History
| Date | Buyer | Sale Price | Title Company |
|---|---|---|---|
| Randhawa Gerveer | $228,500 | None Available | |
| Randhawa Gurveer | $228,500 | None Available | |
| Randhawa Gurveer | -- | None Available | |
| Nationstar Mortgage Llc | $228,500 | None Available | |
| Gell Helen L | -- | First American | |
| Gell Helen L | -- | -- |
Source: Public Records
Mortgage History
| Date | Status | Borrower | Loan Amount |
|---|---|---|---|
| Previous Owner | Gell Helen L | $544,185 |
Source: Public Records
Tax History Compared to Growth
Tax History
| Year | Tax Paid | Tax Assessment Tax Assessment Total Assessment is a certain percentage of the fair market value that is determined by local assessors to be the total taxable value of land and additions on the property. | Land | Improvement |
|---|---|---|---|---|
| 2025 | $3,769 | $535,100 | $422,400 | $112,700 |
| 2024 | $3,769 | $506,000 | $393,300 | $112,700 |
| 2023 | $3,662 | $507,300 | $384,700 | $122,600 |
| 2022 | $2,481 | $294,600 | $241,900 | $52,700 |
| 2020 | $2,311 | $275,500 | $221,200 | $54,300 |
| 2019 | $2,115 | $257,400 | $203,600 | $53,800 |
| 2018 | $2,245 | $237,600 | $188,300 | $49,300 |
| 2017 | $1,852 | $202,900 | $160,800 | $42,100 |
| 2016 | $2,071 | $225,300 | $130,900 | $94,400 |
| 2015 | $2,067 | $202,500 | $120,200 | $82,300 |
| 2013 | $667 | $160,400 | $95,000 | $65,400 |
Source: Public Records
Map
Nearby Homes
- 7926 46th Ave W
- 4803 84th St SW
- 8211 Mukilteo Speedway
- 8010 Mukilteo Speedway Unit 105
- 8010 Mukilteo Speedway Unit 110
- 5029 84th St SW Unit 301
- 5029 84th St SW Unit 109
- 8221 53rd Ave W Unit G28
- 8221 53rd Ave W Unit F55
- 8851 48th Place W
- 4632 74th St SW
- 9124 44th Ave W
- 5321 80th Place SW
- 7920 53rd Ave W Unit D
- 8116 Naketa Beach Walk
- 1902 Clover Place
- 1803 19th Dr
- 5700 Sunset Ln
- 0 Hill St
- 5730 94th Place SW
- 8208 44th Ave W
- 8130 44th Ave W
- 8214 44th Ave W
- 8118 44th Ave W
- 8127 45th Ave W
- 8119 45th Ave W
- 8220 44th Ave W
- 8114 44th Ave W
- 8126 45th Ave W
- 8113 45th Ave W
- 8215 45th Place W
- 8107 45th Ave W
- 8221 45th Place W
- 8122 45th Ave W
- 8032 44th Ave W
- 8118 45th Ave W
- 8229 45th Place W
- 8209 45th Place W
- 8033 45th Ave W
- 8110 45th Ave W