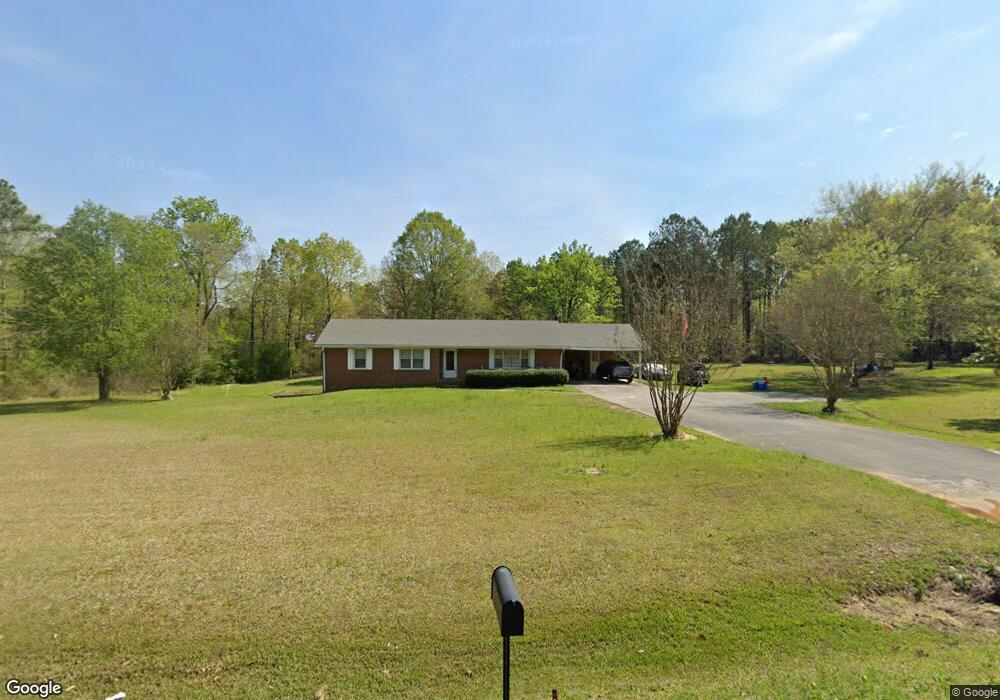
8208 Blacks Bluff Rd SW Cave Spring, GA 30124
Estimated Value: $224,000 - $305,000
--
Bed
--
Bath
1,580
Sq Ft
$168/Sq Ft
Est. Value
About This Home
This home is located at 8208 Blacks Bluff Rd SW, Cave Spring, GA 30124 and is currently estimated at $265,487, approximately $168 per square foot. 8208 Blacks Bluff Rd SW is a home located in Floyd County with nearby schools including Coosa Middle School and Coosa High School.
Ownership History
Date
Name
Owned For
Owner Type
Purchase Details
Closed on
Aug 17, 2012
Sold by
Terry J Harlin
Bought by
Weeks Misty Denise and Weeks Samuel Lamar
Current Estimated Value
Home Financials for this Owner
Home Financials are based on the most recent Mortgage that was taken out on this home.
Original Mortgage
$75,013
Interest Rate
3.58%
Mortgage Type
New Conventional
Purchase Details
Closed on
Mar 22, 2007
Sold by
Not Provided
Bought by
Terry J Harlin
Purchase Details
Closed on
Oct 18, 1999
Sold by
State Line Baptist Church Inc
Bought by
Terry J Harlin
Purchase Details
Closed on
Aug 20, 1991
Sold by
State Line Baptist Church
Bought by
State Line Baptist Church Inc
Purchase Details
Closed on
Feb 9, 1975
Bought by
P and R
Purchase Details
Closed on
Feb 8, 1975
Bought by
P and R
Purchase Details
Closed on
Aug 10, 1973
Bought by
State Line Baptist Church
Create a Home Valuation Report for This Property
The Home Valuation Report is an in-depth analysis detailing your home's value as well as a comparison with similar homes in the area
Home Values in the Area
Average Home Value in this Area
Purchase History
| Date | Buyer | Sale Price | Title Company |
|---|---|---|---|
| Weeks Misty Denise | $82,500 | -- | |
| Terry J Harlin | -- | -- | |
| Terry J Harlin | $80,300 | -- | |
| P | -- | -- | |
| State Line Baptist Church Inc | -- | -- | |
| P | -- | -- | |
| P | -- | -- | |
| State Line Baptist Church | -- | -- |
Source: Public Records
Mortgage History
| Date | Status | Borrower | Loan Amount |
|---|---|---|---|
| Closed | Weeks Misty Denise | $75,013 |
Source: Public Records
Tax History Compared to Growth
Tax History
| Year | Tax Paid | Tax Assessment Tax Assessment Total Assessment is a certain percentage of the fair market value that is determined by local assessors to be the total taxable value of land and additions on the property. | Land | Improvement |
|---|---|---|---|---|
| 2024 | $1,625 | $75,801 | $16,896 | $58,905 |
| 2023 | $1,617 | $73,267 | $15,360 | $57,907 |
| 2022 | $1,314 | $54,031 | $12,672 | $41,359 |
| 2021 | $1,171 | $44,981 | $11,533 | $33,448 |
| 2020 | $1,133 | $42,413 | $10,029 | $32,384 |
| 2019 | $1,099 | $41,288 | $10,029 | $31,259 |
| 2018 | $1,071 | $39,626 | $9,552 | $30,074 |
| 2017 | $1,050 | $38,370 | $8,845 | $29,525 |
| 2016 | $1,045 | $37,435 | $8,840 | $28,595 |
| 2015 | $892 | $37,435 | $8,840 | $28,595 |
| 2014 | $892 | $37,435 | $8,840 | $28,595 |
Source: Public Records
Map
Nearby Homes
- 8203 Blacks Bluff Rd SW
- 0 George Rd SW Unit 10567389
- 0 George Rd SW Unit 7618177
- 8006 Blacks Bluff Rd SW
- 450 County Road 803
- 11 County Road 182
- 1801 County Road 182 Unit 4Lots
- 60 County Road 182
- 7 County Road 182
- 1310 County Road 182
- 86 County Road 182
- 10 County Road 182
- Lot 13 County Road 480
- 1865 Morton Bend Rd
- 891 County Road 1008
- 1725 County Road 182 Unit 37,38
- 1725 County Road 182 Unit 18
- Lot 79 County Road 1008
- Lot 17 County Road 620
- 880 County Road 1008
- 78 George Rd SW
- 2 George Rd SW
- 0 George Rd SW
- 0 George Rd SW Unit 10141418
- 0 George Rd SW Unit 7183734
- 0 George Rd SW Unit 20084964
- 0 George Rd SW Unit 7398346
- 0 George Rd SW Unit 7296539
- 0 George Rd SW Unit 7150906
- 0 George Rd SW Unit 8143119
- 0 George Rd SW Unit 5192871
- 0 George Rd SW Unit 6665844
- 0 George Rd SW Unit 8666133
- 60 George Rd SW
- 106 George Rd SW
- 116 George Rd SW
- 8091 Blacks Bluff Rd SW
- 121 George Rd SW
- 190 George Rd SW Unit 10/12
- 8375 Blacks Bluff Rd SW