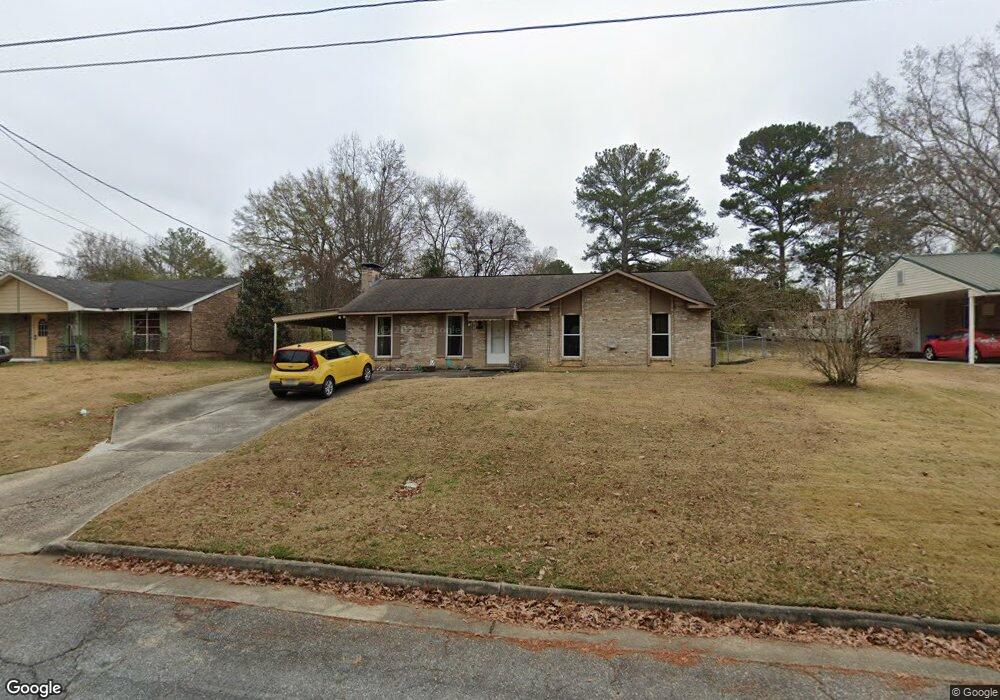
8208 Trafalgar Way Columbus, GA 31904
North Columbus NeighborhoodEstimated Value: $173,000 - $190,000
3
Beds
2
Baths
1,350
Sq Ft
$133/Sq Ft
Est. Value
About This Home
This home is located at 8208 Trafalgar Way, Columbus, GA 31904 and is currently estimated at $179,475, approximately $132 per square foot. 8208 Trafalgar Way is a home located in Muscogee County with nearby schools including Double Churches Elementary School, Veterans Memorial Middle School, and Northside High School.
Ownership History
Date
Name
Owned For
Owner Type
Purchase Details
Closed on
May 25, 2018
Sold by
Baggett Michael Jo
Bought by
Creamer Bertha J
Current Estimated Value
Home Financials for this Owner
Home Financials are based on the most recent Mortgage that was taken out on this home.
Original Mortgage
$90,811
Outstanding Balance
$78,371
Interest Rate
4.5%
Mortgage Type
FHA
Estimated Equity
$101,104
Purchase Details
Closed on
Oct 6, 2016
Sold by
Carolyn Coulter Howard
Bought by
Baggett Michael
Home Financials for this Owner
Home Financials are based on the most recent Mortgage that was taken out on this home.
Original Mortgage
$80,250
Interest Rate
3.42%
Purchase Details
Closed on
Feb 5, 2010
Sold by
Creamer Bertha Jo
Bought by
Baggett Michael Jo and Creamer Waymond Deland
Create a Home Valuation Report for This Property
The Home Valuation Report is an in-depth analysis detailing your home's value as well as a comparison with similar homes in the area
Home Values in the Area
Average Home Value in this Area
Purchase History
| Date | Buyer | Sale Price | Title Company |
|---|---|---|---|
| Creamer Bertha J | $105,000 | -- | |
| Baggett Michael | -- | -- | |
| Baggett Michael Jo | -- | None Available |
Source: Public Records
Mortgage History
| Date | Status | Borrower | Loan Amount |
|---|---|---|---|
| Open | Creamer Bertha J | $90,811 | |
| Previous Owner | Baggett Michael | $80,250 | |
| Previous Owner | Baggett Michael | -- |
Source: Public Records
Tax History Compared to Growth
Tax History
| Year | Tax Paid | Tax Assessment Tax Assessment Total Assessment is a certain percentage of the fair market value that is determined by local assessors to be the total taxable value of land and additions on the property. | Land | Improvement |
|---|---|---|---|---|
| 2025 | $1,128 | $52,492 | $8,244 | $44,248 |
| 2024 | $1,127 | $52,492 | $8,244 | $44,248 |
| 2023 | $440 | $52,492 | $8,244 | $44,248 |
| 2022 | $1,175 | $44,488 | $8,244 | $36,244 |
| 2021 | $1,168 | $42,404 | $8,244 | $34,160 |
| 2020 | $1,169 | $42,404 | $8,244 | $34,160 |
| 2019 | $1,174 | $42,000 | $7,960 | $34,040 |
| 2018 | $1,042 | $43,360 | $8,244 | $35,116 |
| 2017 | $1,047 | $43,360 | $8,244 | $35,116 |
| 2016 | $1,052 | $38,768 | $4,032 | $34,736 |
| 2015 | $1,054 | $38,768 | $4,032 | $34,736 |
| 2014 | $1,055 | $38,768 | $4,032 | $34,736 |
| 2013 | -- | $37,800 | $4,032 | $33,768 |
Source: Public Records
Map
Nearby Homes
- 1206 Rock Bridge Dr
- 8344 Twin Chapel Dr
- 1579 Magnolia Way
- 1058 Cedarbrook Dr
- 994 Timber Creek Way
- 1442 Grove Park Dr Unit 2
- 1442 Grove Park Dr Unit 8
- 1727 Fountain Ct
- 907 Eden St
- 7841 Edgewater Dr
- 7635 Edgewater Dr
- 1438 Grove Park Dr Unit 13B
- 7601 Edgewater Dr
- 1719 Double Churches Rd
- 907 Double Churches Rd
- 1287 Woodville Ct
- 7407 Peppercorn Dr
- 7348 Cedar Creek Loop
- 517 Double Churches Rd
- 281 Zachary Ct
- 8216 Trafalgar Way
- 8202 Trafalgar Way
- 8209 Bryn Mawr Ln
- 8222 Trafalgar Way
- 8201 Bryn Mawr Ln
- 8217 Bryn Mawr Ln
- 8209 Trafalgar Way
- 8201 Trafalgar Way
- 8217 Trafalgar Way
- 8228 Trafalgar Way
- 8122 Trafalgar Way
- 8225 Bryn Mawr Ln
- 8223 Trafalgar Way
- 8145 Bryn Mawr Ln
- 8231 Trafalgar Way
- 8234 Trafalgar Way
- 1332 Rockbridge Dr
- 8116 Trafalgar Way
- 8202 Rockbridge Ct
- 8208 Rockbridge Ct