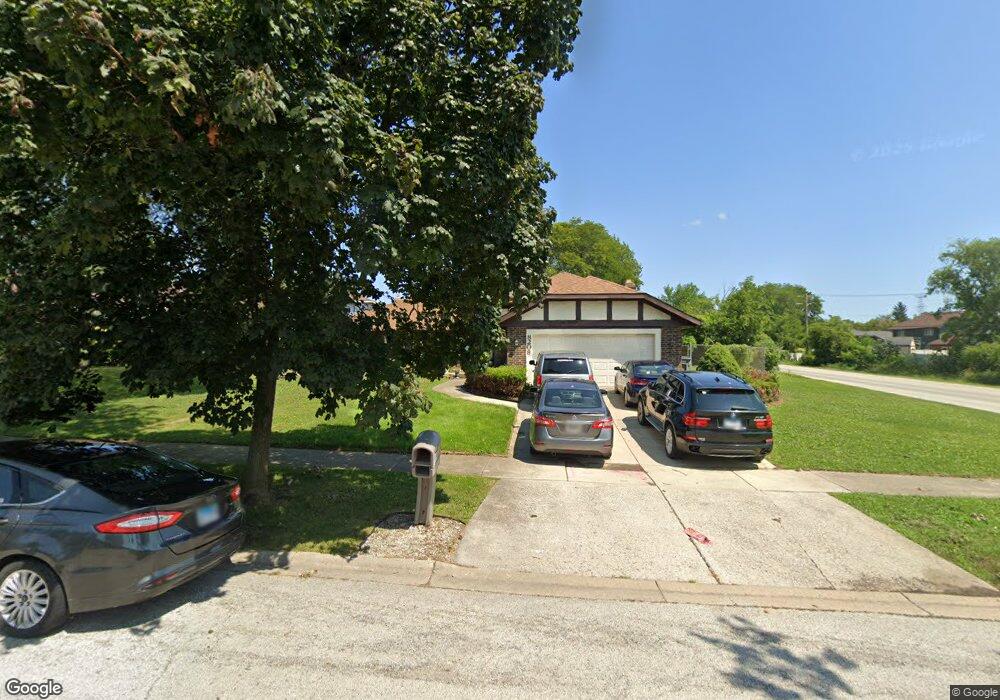
8208 W 141st St Orland Park, IL 60462
Silver Lake North NeighborhoodEstimated Value: $400,000 - $422,000
3
Beds
2
Baths
1,321
Sq Ft
$312/Sq Ft
Est. Value
About This Home
This home is located at 8208 W 141st St, Orland Park, IL 60462 and is currently estimated at $412,318, approximately $312 per square foot. 8208 W 141st St is a home located in Cook County with nearby schools including Prairie Elementary School, Liberty Elementary School, and Jerling Junior High School.
Ownership History
Date
Name
Owned For
Owner Type
Purchase Details
Closed on
Dec 16, 2005
Sold by
Almada Suha
Bought by
Almadi Suha
Current Estimated Value
Home Financials for this Owner
Home Financials are based on the most recent Mortgage that was taken out on this home.
Original Mortgage
$244,000
Outstanding Balance
$156,991
Interest Rate
8.95%
Mortgage Type
Unknown
Estimated Equity
$255,327
Purchase Details
Closed on
May 26, 2000
Sold by
Alkurdi Abdelhadi and Al Madi Suha M
Bought by
Al Madi Suha M
Purchase Details
Closed on
Oct 15, 1998
Sold by
Chicago Title Land Trust Company
Bought by
Alkurdi Abdelhadi
Purchase Details
Closed on
Nov 25, 1997
Sold by
Alkurdi Abdelhadi A
Bought by
The Chicago Trust Company and Trust #1103727
Purchase Details
Closed on
May 29, 1997
Sold by
Lorenzen Edward L and Lorenzen Mary Ann
Bought by
Alkurdi Abdelhadi
Home Financials for this Owner
Home Financials are based on the most recent Mortgage that was taken out on this home.
Original Mortgage
$154,500
Interest Rate
8.13%
Create a Home Valuation Report for This Property
The Home Valuation Report is an in-depth analysis detailing your home's value as well as a comparison with similar homes in the area
Home Values in the Area
Average Home Value in this Area
Purchase History
| Date | Buyer | Sale Price | Title Company |
|---|---|---|---|
| Almadi Suha | -- | Cti | |
| Al Madi Suha M | -- | Chicago Title Insurance Co | |
| Alkurdi Abdelhadi | -- | -- | |
| The Chicago Trust Company | -- | -- | |
| Alkurdi Abdelhadi | $206,000 | -- |
Source: Public Records
Mortgage History
| Date | Status | Borrower | Loan Amount |
|---|---|---|---|
| Open | Almadi Suha | $244,000 | |
| Previous Owner | Alkurdi Abdelhadi | $154,500 |
Source: Public Records
Tax History Compared to Growth
Tax History
| Year | Tax Paid | Tax Assessment Tax Assessment Total Assessment is a certain percentage of the fair market value that is determined by local assessors to be the total taxable value of land and additions on the property. | Land | Improvement |
|---|---|---|---|---|
| 2024 | $7,929 | $35,001 | $8,096 | $26,905 |
| 2023 | $6,443 | $35,001 | $8,096 | $26,905 |
| 2022 | $6,443 | $24,930 | $7,016 | $17,914 |
| 2021 | $6,249 | $24,929 | $7,016 | $17,913 |
| 2020 | $7,248 | $26,028 | $7,016 | $19,012 |
| 2019 | $7,450 | $27,143 | $6,476 | $20,667 |
| 2018 | $7,246 | $27,143 | $6,476 | $20,667 |
| 2017 | $7,082 | $27,143 | $6,476 | $20,667 |
| 2016 | $6,342 | $22,728 | $5,936 | $16,792 |
| 2015 | $6,281 | $22,728 | $5,936 | $16,792 |
| 2014 | $6,188 | $22,728 | $5,936 | $16,792 |
| 2013 | $6,462 | $25,212 | $5,936 | $19,276 |
Source: Public Records
Map
Nearby Homes
- 14023 Chelsea Dr
- 8134 Uxbridge Dr
- 14255 Wedgewood Glens Dr
- 8115 Pluskota Dr
- 8005 W 143rd Place
- 8005 Trafalgar Ct
- 13623 S 84th Ave
- 14567 S 82nd Ave
- 14040 Boxwood Ln
- 8132 Pickens Dr
- 8700 Berkley Ct
- 14345 S 87th Ave
- 8820 W 140th St Unit 2A
- 14508 Maycliff Dr
- 14453 S 88th Ave
- 13550 86th Ave
- Richmond Plan at Misty Meadow
- Dartmore Plan at Misty Meadow
- Compton Plan at Misty Meadow
- Beaumont Plan at Misty Meadow
- 8216 W 141st St
- 8215 Shipston St
- 14055 Chelsea Dr
- 8224 W 141st St
- 14066 Putney Place
- 14062 Putney Place
- 8215 W 141st St
- 14074 Putney Place
- 14058 Putney Place
- 8223 W 141st St
- 14108 Putney Place
- 8232 W 141st St
- 14050 Putney Place
- 14047 Chelsea Dr
- 8231 Shipston St
- 8231 W 141st St
- 14116 Putney Place
- 14042 Putney Place
- 8240 W 141st St