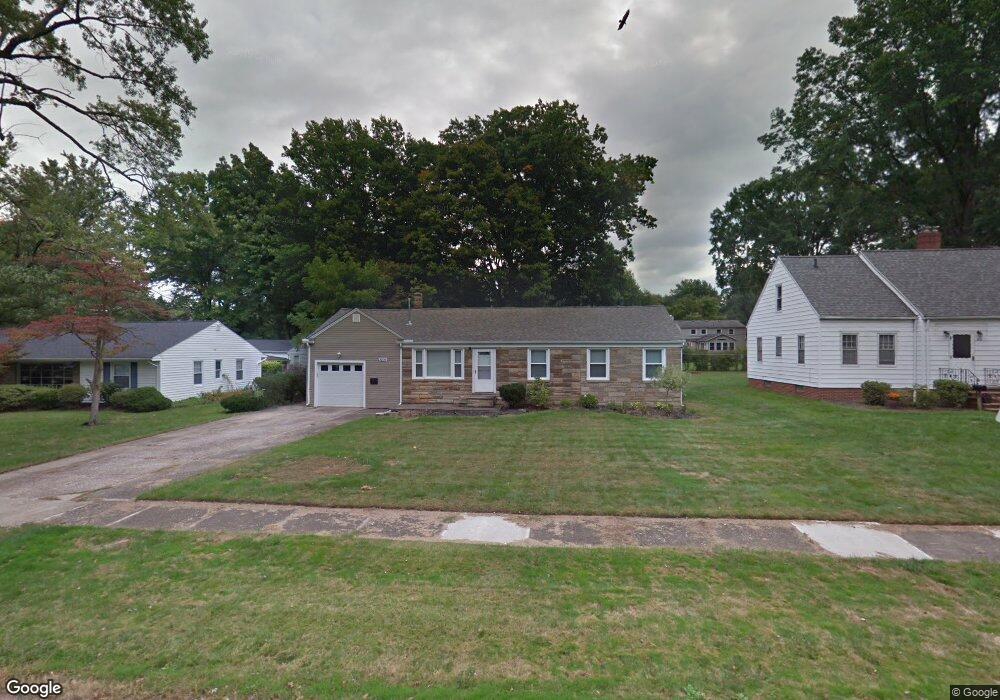
8209 Eastmoor Rd Mentor, OH 44060
Estimated Value: $210,245 - $251,000
3
Beds
2
Baths
1,332
Sq Ft
$176/Sq Ft
Est. Value
About This Home
This home is located at 8209 Eastmoor Rd, Mentor, OH 44060 and is currently estimated at $234,561, approximately $176 per square foot. 8209 Eastmoor Rd is a home located in Lake County with nearby schools including Memorial Middle School, Mentor High School, and Andrews Osborne Academy.
Ownership History
Date
Name
Owned For
Owner Type
Purchase Details
Closed on
Jul 14, 2020
Sold by
Levine David A
Bought by
Patterson Drew
Current Estimated Value
Home Financials for this Owner
Home Financials are based on the most recent Mortgage that was taken out on this home.
Original Mortgage
$175,750
Outstanding Balance
$155,843
Interest Rate
3.1%
Mortgage Type
New Conventional
Estimated Equity
$78,718
Purchase Details
Closed on
Dec 20, 2015
Sold by
Kolk Frank and Kolk Frank
Bought by
Kolk Ii Frank
Purchase Details
Closed on
Dec 10, 2013
Sold by
Kolk Frank and Kolk Frank
Bought by
Levine David A
Home Financials for this Owner
Home Financials are based on the most recent Mortgage that was taken out on this home.
Original Mortgage
$76,000
Interest Rate
3.18%
Mortgage Type
Future Advance Clause Open End Mortgage
Purchase Details
Closed on
Aug 6, 2004
Sold by
Campbell Jan M and Kruze Klemens J
Bought by
Kolk Frank and Kolk Margaret
Purchase Details
Closed on
Feb 2, 1977
Bought by
Kruze Klemens J
Create a Home Valuation Report for This Property
The Home Valuation Report is an in-depth analysis detailing your home's value as well as a comparison with similar homes in the area
Home Values in the Area
Average Home Value in this Area
Purchase History
| Date | Buyer | Sale Price | Title Company |
|---|---|---|---|
| Patterson Drew | $185,000 | None Available | |
| Kolk Ii Frank | -- | None Available | |
| Levine David A | $95,000 | None Available | |
| Kolk Frank | $110,000 | U S Title Agency Inc | |
| Kruze Klemens J | -- | -- |
Source: Public Records
Mortgage History
| Date | Status | Borrower | Loan Amount |
|---|---|---|---|
| Open | Patterson Drew | $175,750 | |
| Previous Owner | Levine David A | $76,000 |
Source: Public Records
Tax History Compared to Growth
Tax History
| Year | Tax Paid | Tax Assessment Tax Assessment Total Assessment is a certain percentage of the fair market value that is determined by local assessors to be the total taxable value of land and additions on the property. | Land | Improvement |
|---|---|---|---|---|
| 2024 | -- | $60,850 | $15,230 | $45,620 |
| 2023 | $5,003 | $48,150 | $12,810 | $35,340 |
| 2022 | $2,218 | $48,150 | $12,810 | $35,340 |
| 2021 | $2,224 | $48,150 | $12,810 | $35,340 |
| 2020 | $2,114 | $40,130 | $10,680 | $29,450 |
| 2019 | $2,117 | $40,130 | $10,680 | $29,450 |
| 2018 | $2,002 | $34,490 | $16,730 | $17,760 |
| 2017 | $1,906 | $34,490 | $16,730 | $17,760 |
| 2016 | $1,895 | $34,490 | $16,730 | $17,760 |
| 2015 | $1,728 | $34,490 | $16,730 | $17,760 |
| 2014 | $1,710 | $33,650 | $16,730 | $16,920 |
| 2013 | $1,761 | $33,650 | $16,730 | $16,920 |
Source: Public Records
Map
Nearby Homes
- 8250 Broadmoor Rd
- 8119 Dartmoor Rd
- 7364 Johnnycake Ridge Rd
- 8445 Ashton Ct
- Newberry Plan at Brookview Reserve - Crossings
- Mystique Plan at Brookview Reserve - Retreat
- Palmary Plan at Brookview Reserve - Retreat
- Prestige Plan at Brookview Reserve - Retreat
- Mercer Plan at Brookview Reserve - Crossings
- Boardwalk Plan at Brookview Reserve - Crossings
- Linwood Plan at Brookview Reserve - Crossings
- Continental Plan at Brookview Reserve - Crossings
- Prosperity Plan at Brookview Reserve - Retreat
- Park Place Plan at Brookview Reserve - Crossings
- 39030 Arcadia Cir
- 4116 Polo Park Dr
- 7530 Mentor Ave
- 8100 Brookview Ln
- 8250 Deepwood Blvd Unit 7
- 8240 Deepwood Blvd Unit 7-8
- 8215 Eastmoor Rd
- 8201 Eastmoor Rd
- 8204 Broadmoor Rd
- 8208 Broadmoor Rd
- 8214 Broadmoor Rd
- 8210 Eastmoor Rd
- 8214 Eastmoor Rd
- 8202 Eastmoor Rd
- 8231 Eastmoor Rd
- 8222 Broadmoor Rd
- 8190 Broadmoor Rd
- 8220 Eastmoor Rd
- 7421 Crossfield Ave
- 7415 Crossfield Ave
- 8228 Broadmoor Rd
- 7380 Crossfield Rd
- 7380 Crossfield Ave
- 8237 Eastmoor Rd
- 8226 Eastmoor Rd
- 7403 Crossfield Ave