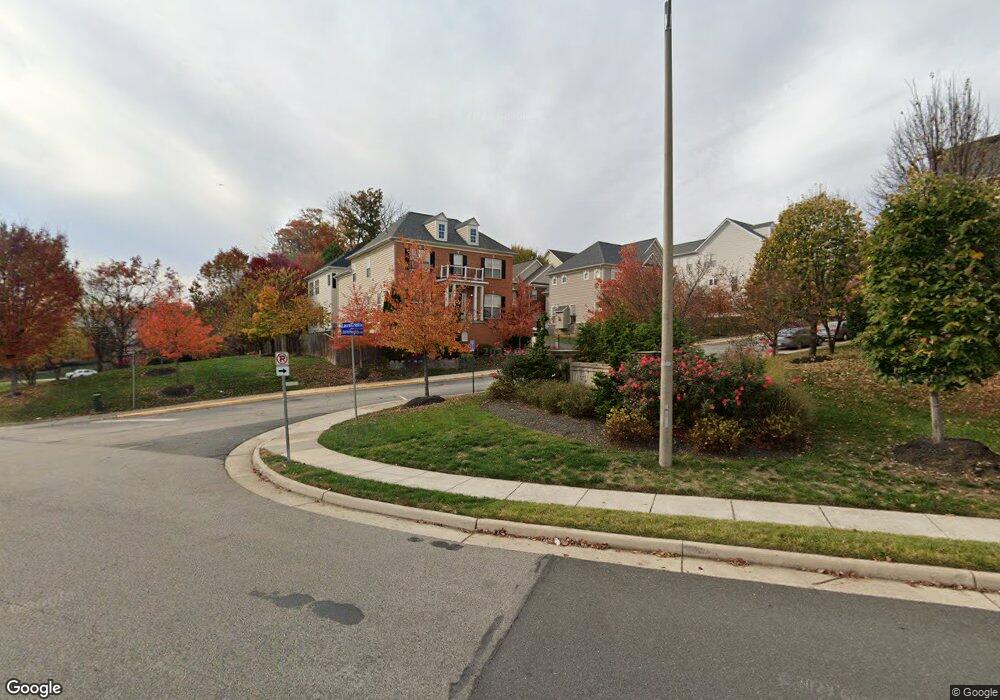
8209 Laurel Heights Loop Lorton, VA 22079
Estimated Value: $749,000 - $805,000
4
Beds
4
Baths
2,218
Sq Ft
$350/Sq Ft
Est. Value
About This Home
This home is located at 8209 Laurel Heights Loop, Lorton, VA 22079 and is currently estimated at $775,507, approximately $349 per square foot. 8209 Laurel Heights Loop is a home located in Fairfax County with nearby schools including Laurel Hill Elementary School, South County Middle School, and South County High School.
Ownership History
Date
Name
Owned For
Owner Type
Purchase Details
Closed on
May 28, 2009
Sold by
Deutsche Bank Trust Co Am
Bought by
Tse Young T and Leung,Kit C
Current Estimated Value
Home Financials for this Owner
Home Financials are based on the most recent Mortgage that was taken out on this home.
Original Mortgage
$292,500
Outstanding Balance
$186,395
Interest Rate
4.93%
Mortgage Type
New Conventional
Estimated Equity
$589,112
Purchase Details
Closed on
Aug 26, 2005
Sold by
Amin Muhammad
Bought by
Osardu Samuel
Home Financials for this Owner
Home Financials are based on the most recent Mortgage that was taken out on this home.
Original Mortgage
$462,000
Interest Rate
5.81%
Mortgage Type
New Conventional
Purchase Details
Closed on
Mar 25, 2005
Sold by
Richmond American Hms Of
Bought by
Amin Muhammad
Home Financials for this Owner
Home Financials are based on the most recent Mortgage that was taken out on this home.
Original Mortgage
$447,492
Interest Rate
5.56%
Mortgage Type
New Conventional
Create a Home Valuation Report for This Property
The Home Valuation Report is an in-depth analysis detailing your home's value as well as a comparison with similar homes in the area
Home Values in the Area
Average Home Value in this Area
Purchase History
| Date | Buyer | Sale Price | Title Company |
|---|---|---|---|
| Tse Young T | $390,000 | -- | |
| Osardu Samuel | $660,000 | -- | |
| Amin Muhammad | $559,365 | -- |
Source: Public Records
Mortgage History
| Date | Status | Borrower | Loan Amount |
|---|---|---|---|
| Open | Tse Young T | $292,500 | |
| Previous Owner | Osardu Samuel | $462,000 | |
| Previous Owner | Amin Muhammad | $447,492 |
Source: Public Records
Tax History Compared to Growth
Tax History
| Year | Tax Paid | Tax Assessment Tax Assessment Total Assessment is a certain percentage of the fair market value that is determined by local assessors to be the total taxable value of land and additions on the property. | Land | Improvement |
|---|---|---|---|---|
| 2025 | $7,457 | $689,250 | $296,000 | $393,250 |
| 2024 | $7,457 | $643,700 | $256,000 | $387,700 |
| 2023 | $7,264 | $643,700 | $256,000 | $387,700 |
| 2022 | $6,997 | $611,870 | $236,000 | $375,870 |
| 2021 | $6,529 | $556,340 | $221,000 | $335,340 |
| 2020 | $6,201 | $523,930 | $206,000 | $317,930 |
| 2019 | $6,201 | $523,930 | $206,000 | $317,930 |
| 2018 | $6,025 | $523,930 | $206,000 | $317,930 |
| 2017 | $6,083 | $523,930 | $206,000 | $317,930 |
| 2016 | $5,773 | $498,330 | $196,000 | $302,330 |
| 2015 | $5,363 | $480,570 | $191,000 | $289,570 |
| 2014 | $4,861 | $436,570 | $166,000 | $270,570 |
Source: Public Records
Map
Nearby Homes
- 8187 Douglas Fir Dr
- 9071 Power House Rd Unit 102
- 8090 Paper Birch Dr
- 9215 Cardinal Forest Ln Unit 29
- 9220G Cardinal Forest Ln Unit 9220G
- 9220 Cardinal Forest Ln Unit E
- 9253 Cardinal Forest Ln Unit 101
- 8205 Crossbrook Ct Unit 201
- 8912 Yellow Daisy Place
- 8165 Halley Ct Unit 301
- 9257 Plaskett Ln
- 8970 Fascination Ct Unit 315
- 8703 Flowering Dogwood Ln
- 9400 Dandelion Dr
- 9407 Dandelion Dr
- 9410 Dandelion Dr
- 9421 Dandelion Dr
- 9414 Dandelion Dr
- 9416 Dandelion Dr
- 9418 Dandelion Dr
- 8207 Laurel Heights Loop
- 8211 Laurel Heights Loop
- 8286 Laurel Heights Loop
- 8205 Laurel Heights Loop
- 8284 Laurel Heights Loop
- 8288 Laurel Heights Loop
- 8282 Laurel Heights Loop
- 8212 Laurel Heights Loop
- 8285 Laurel Heights Loop
- 8287 Laurel Heights Loop
- 8280 Laurel Heights Loop
- 8283 Laurel Heights Loop
- 8262 Silverbrook Rd
- 8289 Laurel Heights Loop
- 8218 Laurel Heights Loop
- 8214 Laurel Heights Loop
- 8220 Laurel Heights Loop
- 8249 Laurel Heights Loop
- 8245 Laurel Heights Loop
- 8251 Laurel Heights Loop