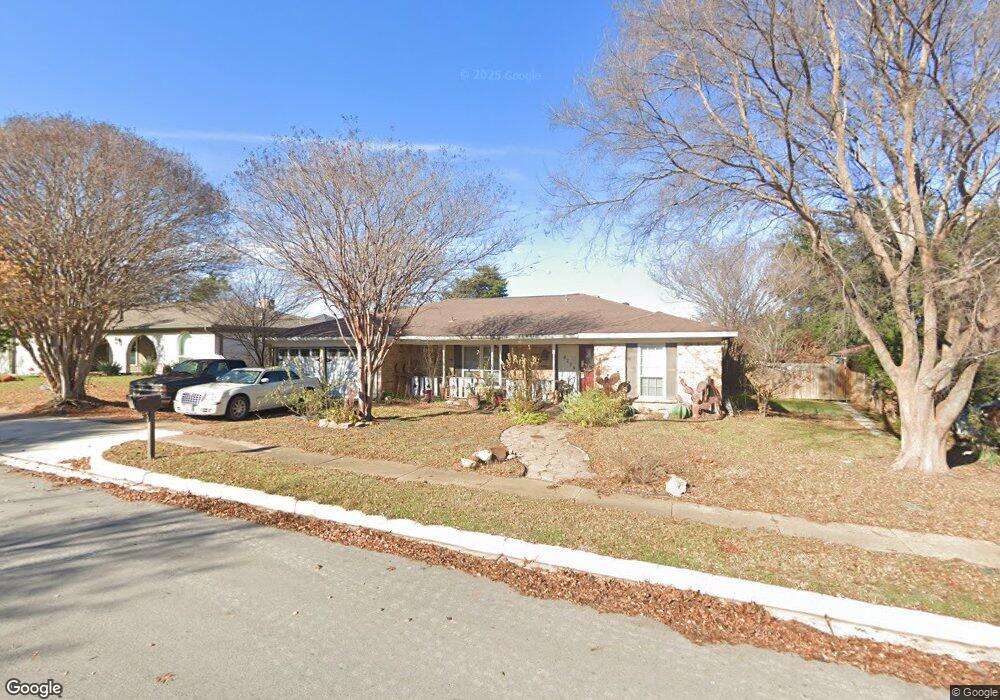
8209 Pearl St North Richland Hills, TX 76180
Estimated Value: $339,894 - $378,000
3
Beds
2
Baths
1,807
Sq Ft
$198/Sq Ft
Est. Value
About This Home
This home is located at 8209 Pearl St, North Richland Hills, TX 76180 and is currently estimated at $357,974, approximately $198 per square foot. 8209 Pearl St is a home located in Tarrant County with nearby schools including Walker Creek Elementary School, Smithfield Middle School, and Birdville High School.
Ownership History
Date
Name
Owned For
Owner Type
Purchase Details
Closed on
May 31, 2002
Sold by
Ramos Julio and Ramos Norberta
Bought by
Jiuliante Richard F
Current Estimated Value
Home Financials for this Owner
Home Financials are based on the most recent Mortgage that was taken out on this home.
Original Mortgage
$92,800
Outstanding Balance
$39,460
Interest Rate
6.89%
Estimated Equity
$318,514
Purchase Details
Closed on
Oct 10, 1997
Sold by
Jenkins Jerry N
Bought by
Ramos Julio
Home Financials for this Owner
Home Financials are based on the most recent Mortgage that was taken out on this home.
Original Mortgage
$66,400
Interest Rate
7.54%
Purchase Details
Closed on
May 23, 1997
Sold by
Hud
Bought by
Jenkins Jerry N
Purchase Details
Closed on
Apr 2, 1996
Sold by
G E Capital Mtg Services Inc
Bought by
Hud
Purchase Details
Closed on
Sep 6, 1994
Sold by
Wilson Carl T and Wilson Stella D
Bought by
G E Capital Asset Management Corp
Create a Home Valuation Report for This Property
The Home Valuation Report is an in-depth analysis detailing your home's value as well as a comparison with similar homes in the area
Home Values in the Area
Average Home Value in this Area
Purchase History
| Date | Buyer | Sale Price | Title Company |
|---|---|---|---|
| Jiuliante Richard F | -- | Fidelity National Title | |
| Ramos Julio | -- | Alamo Title Co | |
| Jenkins Jerry N | -- | -- | |
| Hud | -- | -- | |
| G E Capital Mtg Services Inc | $106,664 | -- | |
| G E Capital Asset Management Corp | -- | -- |
Source: Public Records
Mortgage History
| Date | Status | Borrower | Loan Amount |
|---|---|---|---|
| Open | Jiuliante Richard F | $92,800 | |
| Previous Owner | Ramos Julio | $66,400 | |
| Closed | Jiuliante Richard F | $17,400 |
Source: Public Records
Tax History Compared to Growth
Tax History
| Year | Tax Paid | Tax Assessment Tax Assessment Total Assessment is a certain percentage of the fair market value that is determined by local assessors to be the total taxable value of land and additions on the property. | Land | Improvement |
|---|---|---|---|---|
| 2025 | $3,126 | $272,403 | $60,000 | $212,403 |
| 2024 | $3,126 | $272,403 | $60,000 | $212,403 |
| 2023 | $4,857 | $263,540 | $60,000 | $203,540 |
| 2022 | $4,844 | $233,527 | $35,000 | $198,527 |
| 2021 | $4,657 | $193,258 | $35,000 | $158,258 |
| 2020 | $4,233 | $229,743 | $35,000 | $194,743 |
| 2019 | $3,983 | $231,306 | $35,000 | $196,306 |
| 2018 | $3,137 | $137,492 | $35,000 | $102,492 |
| 2017 | $3,363 | $198,965 | $35,000 | $163,965 |
| 2016 | $3,057 | $172,967 | $15,000 | $157,967 |
| 2015 | $2,465 | $103,300 | $15,000 | $88,300 |
| 2014 | $2,465 | $103,300 | $15,000 | $88,300 |
Source: Public Records
Map
Nearby Homes
- 6250 Shirley Dr
- 8057 Caladium Dr
- 6113 Cliffbrook Dr
- 0 Mid Cities Blvd
- 8020 Bridge St
- 8240 Bridge St
- 8321 Bridge St
- 6017 Avalon St
- 6137 Marquita Mews
- 6116 Morningside Dr
- 8740 Ice House Dr
- 8748 Morris Mews
- 8409 Main St
- 8412 Glenann Dr
- 8409 Glenann Dr
- 7800 Mockingbird Ln Unit 29
- 7800 Mockingbird Ln Unit 81
- 7800 Mockingbird Ln Unit 73
- 7800 Mockingbird Ln Unit 43
- 7800 Mockingbird Ln Unit 205