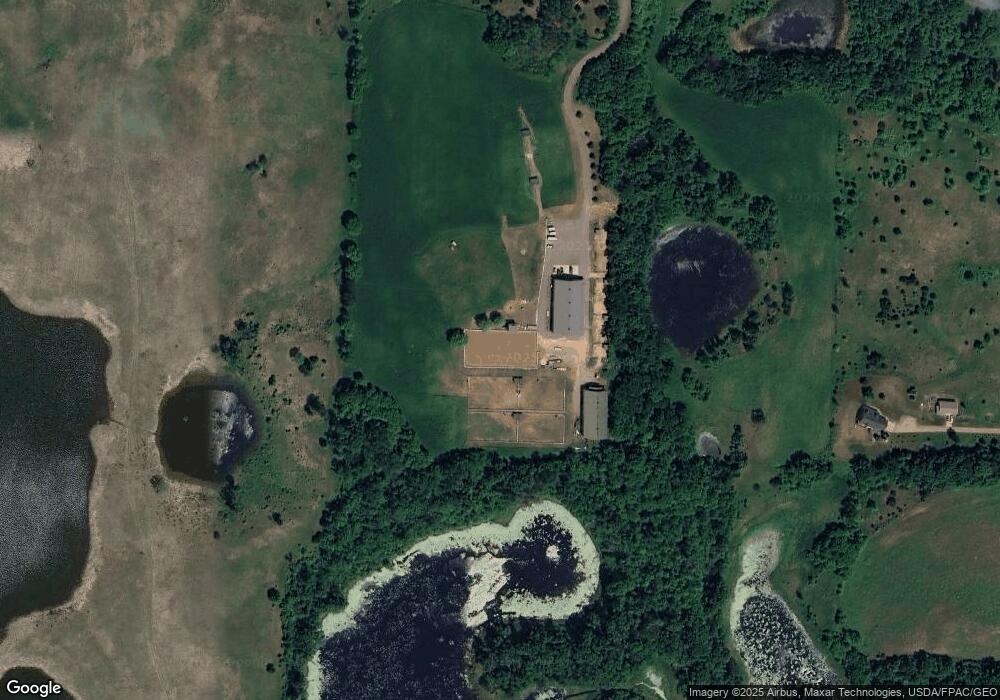
821 160th Ave New Richmond, WI 54017
Estimated Value: $462,000 - $852,000
--
Bed
--
Bath
--
Sq Ft
38.84
Acres
About This Home
This home is located at 821 160th Ave, New Richmond, WI 54017 and is currently estimated at $701,687. 821 160th Ave is a home with nearby schools including New Richmond High School.
Ownership History
Date
Name
Owned For
Owner Type
Purchase Details
Closed on
May 19, 2021
Sold by
Falconer Molly R and Riermann Molly R
Bought by
Black Dog Fields Llc
Current Estimated Value
Home Financials for this Owner
Home Financials are based on the most recent Mortgage that was taken out on this home.
Original Mortgage
$357,000
Outstanding Balance
$322,514
Interest Rate
2.9%
Mortgage Type
Commercial
Estimated Equity
$379,173
Purchase Details
Closed on
May 12, 2020
Sold by
Riermann Penny R
Bought by
Riermann Molly R
Create a Home Valuation Report for This Property
The Home Valuation Report is an in-depth analysis detailing your home's value as well as a comparison with similar homes in the area
Home Values in the Area
Average Home Value in this Area
Purchase History
| Date | Buyer | Sale Price | Title Company |
|---|---|---|---|
| Black Dog Fields Llc | $750,000 | Land Title | |
| Riermann Molly R | -- | None Available |
Source: Public Records
Mortgage History
| Date | Status | Borrower | Loan Amount |
|---|---|---|---|
| Open | Black Dog Fields Llc | $357,000 |
Source: Public Records
Tax History Compared to Growth
Tax History
| Year | Tax Paid | Tax Assessment Tax Assessment Total Assessment is a certain percentage of the fair market value that is determined by local assessors to be the total taxable value of land and additions on the property. | Land | Improvement |
|---|---|---|---|---|
| 2024 | $58 | $466,000 | $128,600 | $337,400 |
| 2023 | $5,122 | $466,200 | $128,800 | $337,400 |
| 2022 | $4,379 | $466,200 | $128,800 | $337,400 |
| 2021 | $4,405 | $282,600 | $86,900 | $195,700 |
| 2020 | $4,572 | $282,700 | $87,000 | $195,700 |
| 2019 | $4,093 | $282,900 | $87,200 | $195,700 |
| 2018 | $4,217 | $282,900 | $87,200 | $195,700 |
| 2017 | $6,524 | $282,900 | $87,200 | $195,700 |
| 2016 | $6,524 | $346,800 | $66,400 | $280,400 |
| 2015 | $6,285 | $346,800 | $66,400 | $280,400 |
| 2014 | $5,837 | $346,800 | $66,400 | $280,400 |
| 2013 | $5,541 | $346,800 | $66,400 | $280,400 |
Source: Public Records
Map
Nearby Homes