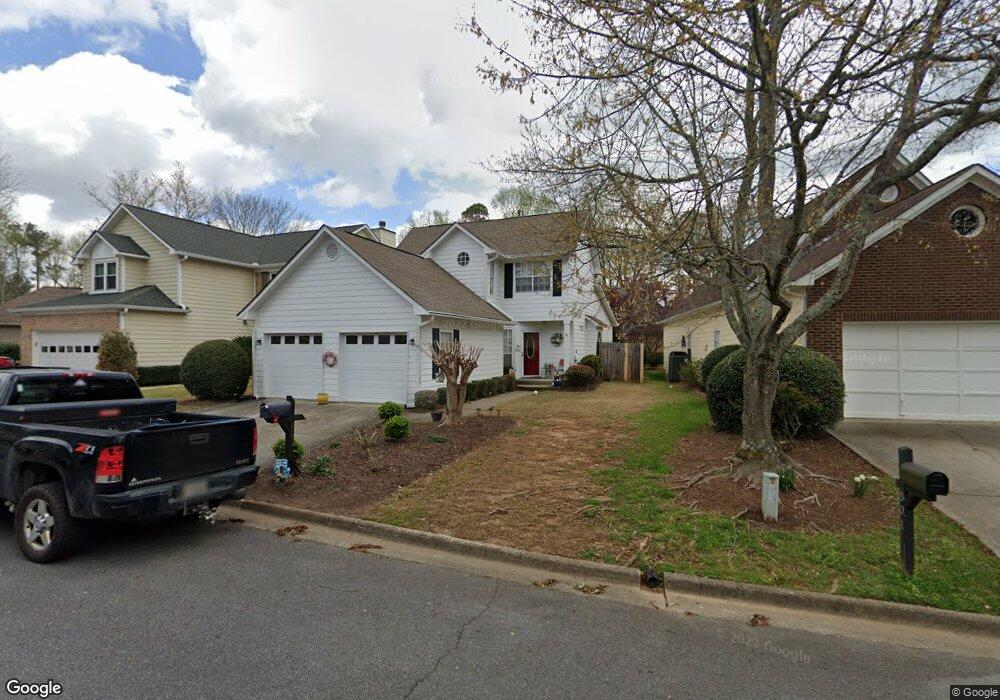
821 Bridge Pointe Ct Alpharetta, GA 30005
Estimated Value: $406,654 - $469,000
3
Beds
3
Baths
1,412
Sq Ft
$320/Sq Ft
Est. Value
About This Home
This home is located at 821 Bridge Pointe Ct, Alpharetta, GA 30005 and is currently estimated at $451,414, approximately $319 per square foot. 821 Bridge Pointe Ct is a home located in Fulton County with nearby schools including New Prospect Elementary School, Webb Bridge Middle School, and Alpharetta High School.
Ownership History
Date
Name
Owned For
Owner Type
Purchase Details
Closed on
May 26, 2000
Sold by
Thiele Sandra
Bought by
Spivak Helen J
Current Estimated Value
Home Financials for this Owner
Home Financials are based on the most recent Mortgage that was taken out on this home.
Original Mortgage
$105,000
Outstanding Balance
$36,726
Interest Rate
8.11%
Mortgage Type
New Conventional
Estimated Equity
$414,688
Purchase Details
Closed on
Jan 19, 1995
Sold by
Jones Denise M
Bought by
Thiele Sandra
Purchase Details
Closed on
Oct 20, 1993
Sold by
Sheridan Andrew E Tina C
Bought by
Jones Denise M
Home Financials for this Owner
Home Financials are based on the most recent Mortgage that was taken out on this home.
Original Mortgage
$94,300
Interest Rate
6.9%
Create a Home Valuation Report for This Property
The Home Valuation Report is an in-depth analysis detailing your home's value as well as a comparison with similar homes in the area
Home Values in the Area
Average Home Value in this Area
Purchase History
| Date | Buyer | Sale Price | Title Company |
|---|---|---|---|
| Spivak Helen J | $155,000 | -- | |
| Thiele Sandra | $107,000 | -- | |
| Jones Denise M | $104,800 | -- |
Source: Public Records
Mortgage History
| Date | Status | Borrower | Loan Amount |
|---|---|---|---|
| Open | Spivak Helen J | $105,000 | |
| Previous Owner | Jones Denise M | $94,300 | |
| Closed | Thiele Sandra | $0 |
Source: Public Records
Tax History Compared to Growth
Tax History
| Year | Tax Paid | Tax Assessment Tax Assessment Total Assessment is a certain percentage of the fair market value that is determined by local assessors to be the total taxable value of land and additions on the property. | Land | Improvement |
|---|---|---|---|---|
| 2025 | $261 | $164,440 | $52,040 | $112,400 |
| 2023 | $3,311 | $117,320 | $24,880 | $92,440 |
| 2022 | $1,633 | $117,320 | $24,880 | $92,440 |
| 2021 | $1,843 | $107,080 | $23,400 | $83,680 |
| 2020 | $1,848 | $107,080 | $21,600 | $85,480 |
| 2019 | $232 | $88,960 | $19,360 | $69,600 |
| 2018 | $1,874 | $86,920 | $18,920 | $68,000 |
| 2017 | $1,576 | $68,000 | $17,840 | $50,160 |
| 2016 | $1,566 | $68,000 | $17,840 | $50,160 |
| 2015 | $1,763 | $68,000 | $17,840 | $50,160 |
| 2014 | $1,463 | $60,480 | $15,880 | $44,600 |
Source: Public Records
Map
Nearby Homes
- 3027 Camden Way
- 3015 Camden Way
- 3087 Camden Way
- 5008 Avalon Dr
- 1005 Whitestone Ridge
- 3750 Brookside Pkwy Unit 37413033
- 1230 Whitestone Ridge Unit 1
- 535 Tumbling Creek Dr Unit 6
- 4345 Park Brooke Trace
- 4255 Park Brooke Trace
- 635 Park Creek Trace
- 3010 Brooke View Ct Unit 5
- 4465 Park Brooke Trace Unit 5
- 437 Argosy Park Cir
- 870 Longstone Landing
- 3965 Brookline Dr
- 1585 Spinnaker Dr
- 4440 Webb Bridge Rd
- 1605 Spinnaker Dr
- 841 Bridge Pointe Ct
- 801 Bridge Pointe Ct
- 0 Bridge Pointe Ct Unit 7262940
- 0 Bridge Pointe Ct Unit 7253942
- 0 Bridge Pointe Ct Unit 7179215
- 0 Bridge Pointe Ct Unit 8638514
- 0 Bridge Pointe Ct Unit 8288880
- 0 Bridge Pointe Ct
- 5723 Bridge Pointe Dr
- 861 Bridge Pointe Ct
- 881 Bridge Pointe Ct
- 5713 Bridge Pointe Dr
- 830 Bridge Pointe Ct
- 840 Bridge Pointe Ct
- 850 Bridge Pointe Ct
- 901 Bridge Pointe Ct
- 800 Bridge Pointe Ct
- 5655 Bridge Pointe Dr
- 5674 Bridge Pointe Dr
- 860 Bridge Pointe Ct