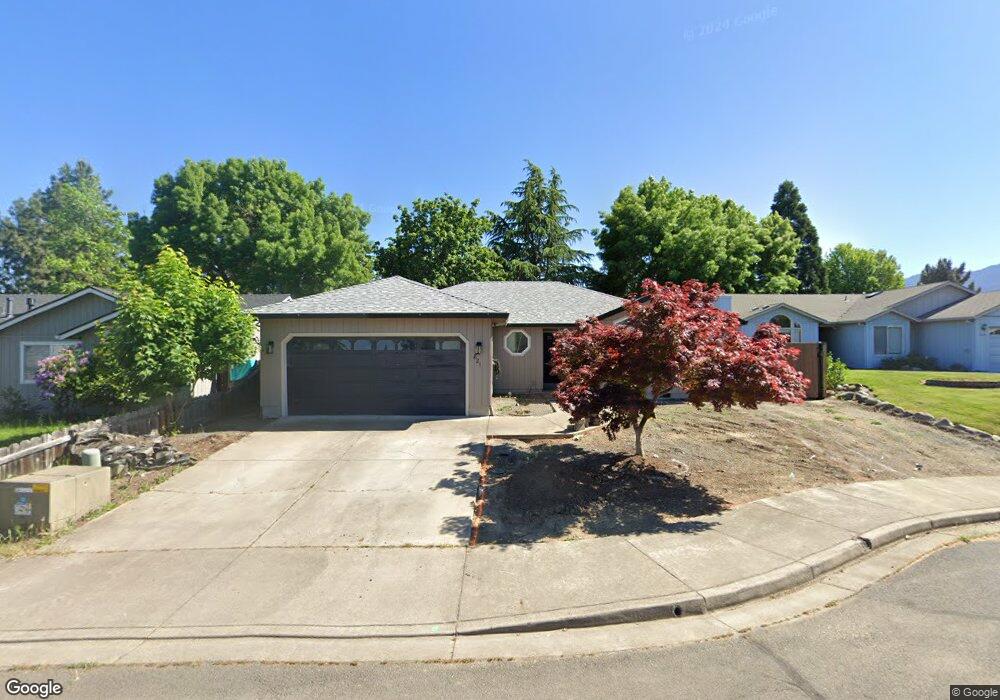
821 Corey Dr Phoenix, OR 97535
Estimated Value: $355,000 - $373,000
3
Beds
2
Baths
1,473
Sq Ft
$247/Sq Ft
Est. Value
About This Home
This home is located at 821 Corey Dr, Phoenix, OR 97535 and is currently estimated at $364,273, approximately $247 per square foot. 821 Corey Dr is a home located in Jackson County with nearby schools including Phoenix Elementary School, Talent Middle School, and Phoenix High School.
Ownership History
Date
Name
Owned For
Owner Type
Purchase Details
Closed on
Aug 24, 2023
Sold by
Dee E Christlieb Trust and Carol C Jensen Trust
Bought by
Cruz Esther Reyes
Current Estimated Value
Home Financials for this Owner
Home Financials are based on the most recent Mortgage that was taken out on this home.
Original Mortgage
$212,657
Outstanding Balance
$207,126
Interest Rate
6.96%
Mortgage Type
FHA
Estimated Equity
$157,147
Purchase Details
Closed on
Mar 26, 2021
Sold by
Jensen Carol Joanne and Jensen Stephen
Bought by
Jensen Carol C and Jensen Stephen E
Purchase Details
Closed on
Feb 5, 2021
Sold by
Dee Christlieb and Dee Carol Christlieb
Bought by
Christlieb Dee E and Christlieb Carol A
Purchase Details
Closed on
Mar 5, 2003
Sold by
Christlieb Norman E and Norman E Christlieb Trust
Bought by
Christlieb Dee and Christlieb Carol
Home Financials for this Owner
Home Financials are based on the most recent Mortgage that was taken out on this home.
Original Mortgage
$90,000
Interest Rate
5.85%
Mortgage Type
Seller Take Back
Create a Home Valuation Report for This Property
The Home Valuation Report is an in-depth analysis detailing your home's value as well as a comparison with similar homes in the area
Home Values in the Area
Average Home Value in this Area
Purchase History
| Date | Buyer | Sale Price | Title Company |
|---|---|---|---|
| Cruz Esther Reyes | $324,000 | First American Title | |
| Jensen Carol C | -- | None Available | |
| Christlieb Dee E | -- | None Available | |
| Christlieb Dee | $150,000 | Lawyers Title Insurance Corp |
Source: Public Records
Mortgage History
| Date | Status | Borrower | Loan Amount |
|---|---|---|---|
| Open | Cruz Esther Reyes | $212,657 | |
| Previous Owner | Christlieb Dee | $90,000 |
Source: Public Records
Tax History
| Year | Tax Paid | Tax Assessment Tax Assessment Total Assessment is a certain percentage of the fair market value that is determined by local assessors to be the total taxable value of land and additions on the property. | Land | Improvement |
|---|---|---|---|---|
| 2026 | $3,086 | $193,510 | -- | -- |
| 2025 | $3,013 | $187,880 | $57,980 | $129,900 |
| 2024 | $3,013 | $182,410 | $56,290 | $126,120 |
| 2023 | $2,918 | $177,100 | $54,660 | $122,440 |
| 2022 | $2,841 | $177,100 | $54,660 | $122,440 |
| 2021 | $2,773 | $171,950 | $53,070 | $118,880 |
| 2020 | $2,686 | $166,950 | $51,520 | $115,430 |
| 2019 | $2,614 | $157,370 | $48,580 | $108,790 |
| 2018 | $2,538 | $152,790 | $47,170 | $105,620 |
| 2017 | $2,398 | $152,790 | $47,170 | $105,620 |
| 2016 | $2,333 | $144,020 | $44,450 | $99,570 |
| 2015 | $2,242 | $144,020 | $44,450 | $99,570 |
| 2014 | $2,157 | $135,760 | $41,900 | $93,860 |
Source: Public Records
Map
Nearby Homes
- 3712 Colver Rd
- 105 W 1st St
- 201 S Rose St
- 130 Sharon Dr
- 316 W 3rd St
- 401 Elm St
- 0 Colver Rd
- 301 N Church St
- 817 Amerman Dr
- 111 E 1st St
- 3459 S Pacific Hwy
- 510 N Main St
- 4624 S Pacific Hwy Unit 61
- 600 N Main St
- 610 N Main St Unit 5A
- 612 N Main St
- 921 N Rose St Unit A
- 300 Luman Rd Unit 200
- 4601 S Pacific Hwy Unit 8
- 4729 S Pacific Hwy Unit 4
Your Personal Tour Guide
Ask me questions while you tour the home.