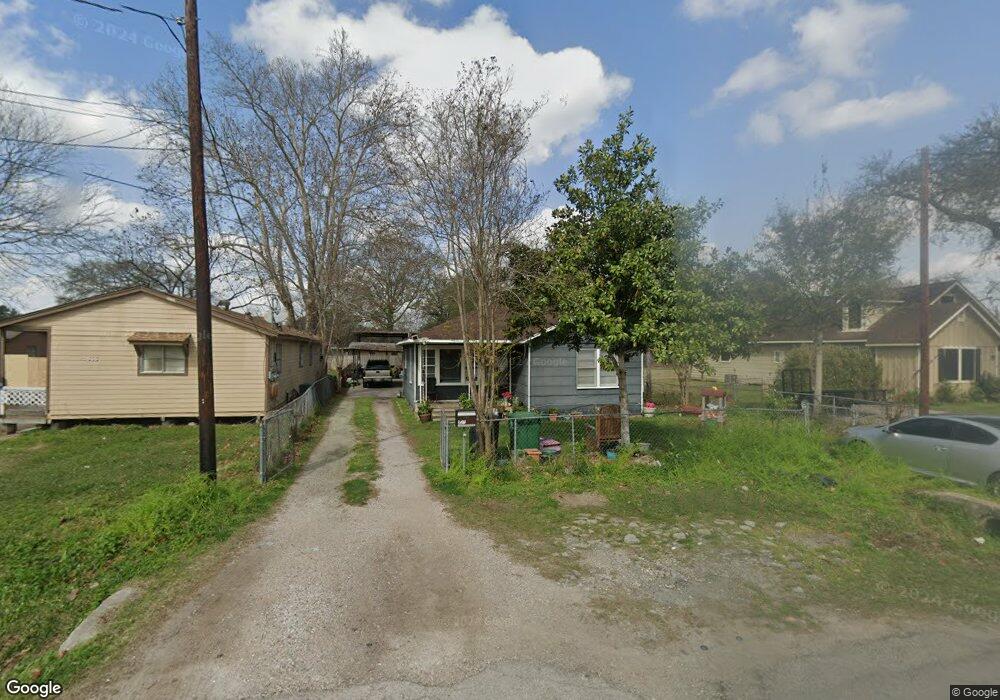
821 De Boll St Houston, TX 77022
Northside-Northline NeighborhoodEstimated Value: $166,486 - $247,000
2
Beds
1
Bath
1,000
Sq Ft
$215/Sq Ft
Est. Value
About This Home
This home is located at 821 De Boll St, Houston, TX 77022 and is currently estimated at $215,372, approximately $215 per square foot. 821 De Boll St is a home located in Harris County with nearby schools including Burbank Elementary School, Burbank Middle School, and Sam Houston Math, Science & Technology Center.
Ownership History
Date
Name
Owned For
Owner Type
Purchase Details
Closed on
Mar 28, 2013
Sold by
Diaz Maria L
Bought by
Contreras J Jesus and Contreras Beatriz C
Current Estimated Value
Home Financials for this Owner
Home Financials are based on the most recent Mortgage that was taken out on this home.
Original Mortgage
$49,094
Outstanding Balance
$35,850
Interest Rate
4.25%
Mortgage Type
FHA
Estimated Equity
$179,522
Purchase Details
Closed on
Mar 21, 2013
Sold by
Diaz Karla Yoani and Diaz Rene Edgardo
Bought by
Diaz Maria L
Home Financials for this Owner
Home Financials are based on the most recent Mortgage that was taken out on this home.
Original Mortgage
$49,094
Outstanding Balance
$35,850
Interest Rate
4.25%
Mortgage Type
FHA
Estimated Equity
$179,522
Create a Home Valuation Report for This Property
The Home Valuation Report is an in-depth analysis detailing your home's value as well as a comparison with similar homes in the area
Home Values in the Area
Average Home Value in this Area
Purchase History
| Date | Buyer | Sale Price | Title Company |
|---|---|---|---|
| Contreras J Jesus | -- | First American Title | |
| Diaz Maria L | -- | First American Title |
Source: Public Records
Mortgage History
| Date | Status | Borrower | Loan Amount |
|---|---|---|---|
| Open | Contreras J Jesus | $49,094 |
Source: Public Records
Tax History Compared to Growth
Tax History
| Year | Tax Paid | Tax Assessment Tax Assessment Total Assessment is a certain percentage of the fair market value that is determined by local assessors to be the total taxable value of land and additions on the property. | Land | Improvement |
|---|---|---|---|---|
| 2025 | $1,373 | $153,361 | $102,600 | $50,761 |
| 2024 | $1,373 | $145,335 | $94,163 | $51,172 |
| 2023 | $1,373 | $135,363 | $57,375 | $77,988 |
| 2022 | $2,433 | $119,656 | $57,375 | $62,281 |
| 2021 | $2,341 | $104,995 | $57,375 | $47,620 |
| 2020 | $2,211 | $99,336 | $57,375 | $41,961 |
| 2019 | $2,100 | $91,440 | $47,250 | $44,190 |
| 2018 | $1,233 | $75,688 | $39,488 | $36,200 |
| 2017 | $1,735 | $75,688 | $39,488 | $36,200 |
| 2016 | $1,577 | $68,734 | $37,125 | $31,609 |
| 2015 | $993 | $56,696 | $27,000 | $29,696 |
| 2014 | $993 | $56,696 | $27,000 | $29,696 |
Source: Public Records
Map
Nearby Homes
- 807 Firnat St
- 702 Pennington St
- 1207 Firnat St
- 723 Doverside St
- 9026 Mcgallion Rd
- 318 Charlock St
- 88 Berry Rd
- 8411 Berry Brush Ln
- 1104 Charnwood St
- 411 Berry Rd
- 8402 Berry Green Ln
- 253 De Boll St
- 249 De Boll St
- 802 Berry Sage Ln
- 216 Burress St
- 415 Briarcliff Dr
- 8205 Appleton St
- 631 Apache St
- 743 Apache St
- 132 Grothe Ln