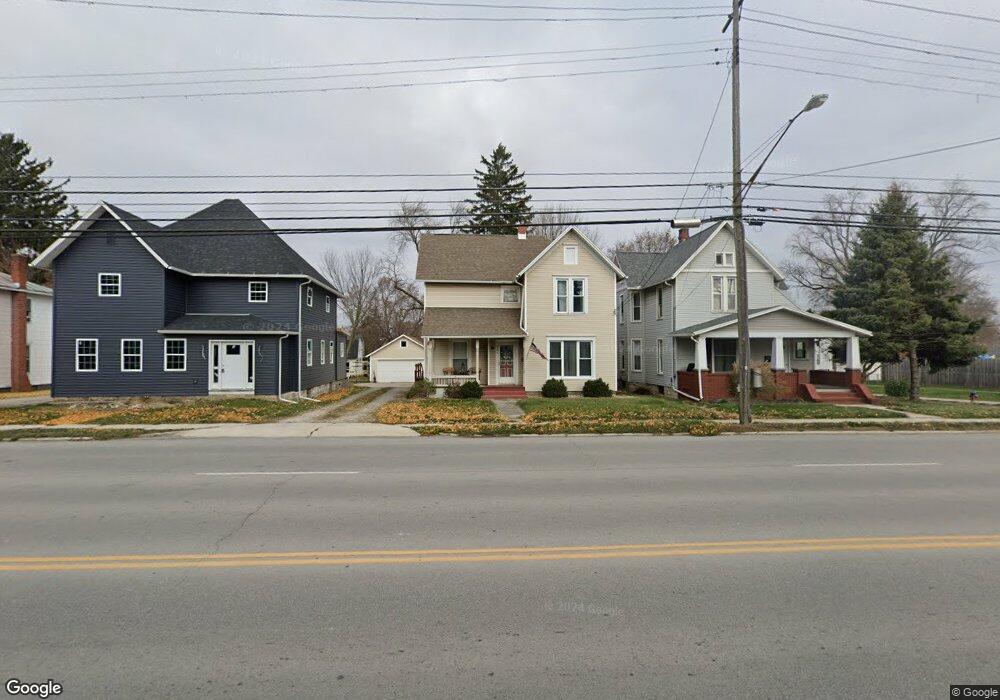
821 E Main St Bellevue, OH 44811
Estimated Value: $146,000 - $194,000
3
Beds
2
Baths
1,650
Sq Ft
$102/Sq Ft
Est. Value
About This Home
This home is located at 821 E Main St, Bellevue, OH 44811 and is currently estimated at $169,092, approximately $102 per square foot. 821 E Main St is a home located in Huron County with nearby schools including Bellevue Elementary School, Bellevue Middle School, and Bellevue High School.
Ownership History
Date
Name
Owned For
Owner Type
Purchase Details
Closed on
Dec 27, 2006
Bought by
Michel Jason and Michel Cindy M
Current Estimated Value
Purchase Details
Closed on
Oct 6, 2006
Bought by
Wells Fargo Bank N A
Purchase Details
Closed on
May 5, 2004
Bought by
Wiswell William K
Purchase Details
Closed on
Sep 23, 1994
Sold by
Balemian Michael W
Bought by
Diehr Leslie O and Diehr Sheryl
Home Financials for this Owner
Home Financials are based on the most recent Mortgage that was taken out on this home.
Original Mortgage
$58,900
Interest Rate
8.62%
Mortgage Type
New Conventional
Create a Home Valuation Report for This Property
The Home Valuation Report is an in-depth analysis detailing your home's value as well as a comparison with similar homes in the area
Home Values in the Area
Average Home Value in this Area
Purchase History
| Date | Buyer | Sale Price | Title Company |
|---|---|---|---|
| Michel Jason | $65,000 | -- | |
| Wells Fargo Bank N A | $51,700 | -- | |
| Wiswell William K | $89,000 | -- | |
| Diehr Leslie O | $62,000 | -- | |
| Diehr Leslie O | $62,000 | -- |
Source: Public Records
Mortgage History
| Date | Status | Borrower | Loan Amount |
|---|---|---|---|
| Previous Owner | Diehr Leslie O | $58,900 |
Source: Public Records
Tax History
| Year | Tax Paid | Tax Assessment Tax Assessment Total Assessment is a certain percentage of the fair market value that is determined by local assessors to be the total taxable value of land and additions on the property. | Land | Improvement |
|---|---|---|---|---|
| 2024 | $2,005 | $48,110 | $5,460 | $42,650 |
| 2023 | $2,006 | $32,970 | $4,170 | $28,800 |
| 2022 | $1,459 | $32,970 | $4,170 | $28,800 |
| 2021 | $1,471 | $32,970 | $4,170 | $28,800 |
| 2020 | $1,184 | $25,080 | $4,170 | $20,910 |
| 2019 | $1,167 | $25,080 | $4,170 | $20,910 |
| 2018 | $1,153 | $25,080 | $4,170 | $20,910 |
| 2017 | $1,064 | $23,760 | $3,990 | $19,770 |
| 2016 | $1,039 | $23,760 | $3,990 | $19,770 |
| 2015 | $1,034 | $23,770 | $3,990 | $19,780 |
| 2014 | $951 | $21,210 | $3,990 | $17,220 |
| 2013 | $940 | $21,210 | $3,990 | $17,220 |
Source: Public Records
Map
Nearby Homes
Your Personal Tour Guide
Ask me questions while you tour the home.