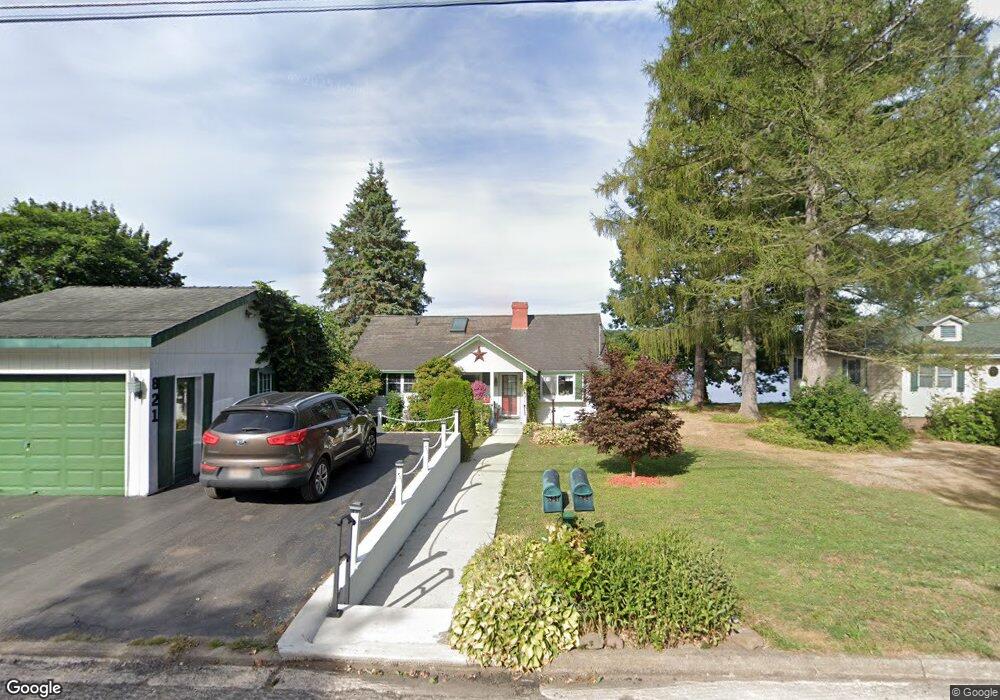
821 Forest Ave Fulton, NY 13069
Estimated Value: $239,655 - $277,000
2
Beds
2
Baths
1,554
Sq Ft
$163/Sq Ft
Est. Value
About This Home
This home is located at 821 Forest Ave, Fulton, NY 13069 and is currently estimated at $253,664, approximately $163 per square foot. 821 Forest Ave is a home located in Oswego County with nearby schools including G Ray Bodley High School.
Ownership History
Date
Name
Owned For
Owner Type
Purchase Details
Closed on
Feb 6, 2020
Sold by
Roth Mark and Roth Denise Macintyre
Bought by
Roth Denise Macintyre
Current Estimated Value
Purchase Details
Closed on
Jan 28, 2015
Sold by
Mckinney Paul R and Bundy William M
Bought by
Roth Mark and Roth Denise Macintyre
Home Financials for this Owner
Home Financials are based on the most recent Mortgage that was taken out on this home.
Original Mortgage
$102,400
Outstanding Balance
$78,575
Interest Rate
3.81%
Mortgage Type
New Conventional
Estimated Equity
$175,089
Purchase Details
Closed on
Aug 16, 1999
Sold by
Wallace Robert O
Bought by
Bundy William M
Create a Home Valuation Report for This Property
The Home Valuation Report is an in-depth analysis detailing your home's value as well as a comparison with similar homes in the area
Home Values in the Area
Average Home Value in this Area
Purchase History
| Date | Buyer | Sale Price | Title Company |
|---|---|---|---|
| Roth Denise Macintyre | -- | None Available | |
| Roth Mark | $128,000 | Chicago Title Insurance Co | |
| Bundy William M | $70,000 | Dennis N Hawthorne, Jr |
Source: Public Records
Mortgage History
| Date | Status | Borrower | Loan Amount |
|---|---|---|---|
| Open | Roth Mark | $102,400 |
Source: Public Records
Tax History
| Year | Tax Paid | Tax Assessment Tax Assessment Total Assessment is a certain percentage of the fair market value that is determined by local assessors to be the total taxable value of land and additions on the property. | Land | Improvement |
|---|---|---|---|---|
| 2024 | $8,507 | $169,000 | $36,400 | $132,600 |
| 2023 | $8,215 | $169,000 | $36,400 | $132,600 |
| 2022 | $7,821 | $169,000 | $36,400 | $132,600 |
| 2021 | $7,845 | $130,400 | $30,500 | $99,900 |
| 2020 | $5,979 | $130,400 | $30,500 | $99,900 |
| 2019 | $4,736 | $130,400 | $30,500 | $99,900 |
| 2018 | $4,736 | $111,300 | $30,500 | $80,800 |
| 2017 | $4,734 | $111,300 | $30,500 | $80,800 |
| 2016 | $5,744 | $111,300 | $30,500 | $80,800 |
| 2015 | -- | $111,300 | $30,500 | $80,800 |
| 2014 | -- | $111,300 | $30,500 | $80,800 |
Source: Public Records
Map
Nearby Homes
Your Personal Tour Guide
Ask me questions while you tour the home.