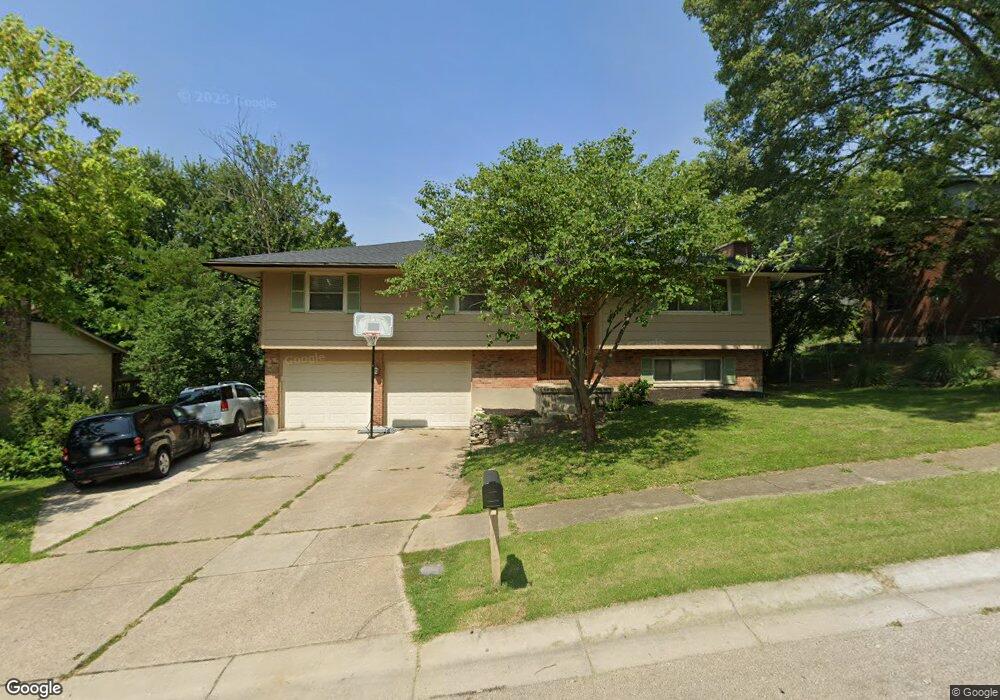
821 Maid Marion Ct Miamisburg, OH 45342
Estimated Value: $259,126 - $281,000
3
Beds
2
Baths
1,442
Sq Ft
$190/Sq Ft
Est. Value
About This Home
This home is located at 821 Maid Marion Ct, Miamisburg, OH 45342 and is currently estimated at $273,282, approximately $189 per square foot. 821 Maid Marion Ct is a home located in Montgomery County with nearby schools including Miamisburg High School and Bethel Baptist School.
Ownership History
Date
Name
Owned For
Owner Type
Purchase Details
Closed on
Nov 10, 2016
Sold by
Barker Brian A and Barker Katharine
Bought by
Wing Phillip A and Wing Amber L
Current Estimated Value
Home Financials for this Owner
Home Financials are based on the most recent Mortgage that was taken out on this home.
Original Mortgage
$132,554
Outstanding Balance
$106,752
Interest Rate
3.52%
Mortgage Type
FHA
Estimated Equity
$166,530
Purchase Details
Closed on
Jun 12, 2012
Sold by
Fader Teresa and Fader Joseph
Bought by
Barker Brian A
Home Financials for this Owner
Home Financials are based on the most recent Mortgage that was taken out on this home.
Original Mortgage
$72,500
Interest Rate
3.83%
Mortgage Type
FHA
Purchase Details
Closed on
Jun 17, 1996
Sold by
Seidenschmidt James A and Seidenschmidt Amy E
Bought by
Barker Brian A and Barker Teresa L
Purchase Details
Closed on
Jun 15, 1994
Sold by
Mccafferty Frank L and Mccafferty Vicki L
Bought by
Seidenschmidt James A and Seidenschmidt Amy E
Create a Home Valuation Report for This Property
The Home Valuation Report is an in-depth analysis detailing your home's value as well as a comparison with similar homes in the area
Home Values in the Area
Average Home Value in this Area
Purchase History
| Date | Buyer | Sale Price | Title Company |
|---|---|---|---|
| Wing Phillip A | $135,000 | Landmark Title Agency South | |
| Barker Brian A | -- | Wational Title | |
| Barker Brian A | $111,500 | -- | |
| Seidenschmidt James A | -- | -- |
Source: Public Records
Mortgage History
| Date | Status | Borrower | Loan Amount |
|---|---|---|---|
| Open | Wing Phillip A | $132,554 | |
| Previous Owner | Barker Brian A | $72,500 |
Source: Public Records
Tax History Compared to Growth
Tax History
| Year | Tax Paid | Tax Assessment Tax Assessment Total Assessment is a certain percentage of the fair market value that is determined by local assessors to be the total taxable value of land and additions on the property. | Land | Improvement |
|---|---|---|---|---|
| 2024 | $4,736 | $74,630 | $14,490 | $60,140 |
| 2023 | $4,736 | $74,630 | $14,490 | $60,140 |
| 2022 | $4,683 | $62,200 | $12,080 | $50,120 |
| 2021 | $4,141 | $62,200 | $12,080 | $50,120 |
| 2020 | $4,134 | $62,200 | $12,080 | $50,120 |
| 2019 | $3,768 | $48,950 | $10,500 | $38,450 |
| 2018 | $3,788 | $48,950 | $10,500 | $38,450 |
| 2017 | $3,771 | $48,950 | $10,500 | $38,450 |
| 2016 | $3,497 | $43,410 | $10,500 | $32,910 |
| 2015 | $3,449 | $43,410 | $10,500 | $32,910 |
| 2014 | $3,449 | $43,410 | $10,500 | $32,910 |
| 2012 | -- | $45,140 | $13,300 | $31,840 |
Source: Public Records
Map
Nearby Homes
- 838 Maid Marion Ct
- 700 N Gebhart Church Rd
- 2302 King Richard Pkwy
- 703 Friar Tuck Ct
- 857 Lea Castle Place
- 524 N Lindsey Ave
- 1803 Cudgell Dr
- 2061 Pine Forest Dr
- 516 N Lindsey Ave
- 514 N Lindsey Ave
- 1678 Carolyn Dr
- 2125 Sherwood Forest Dr
- 1642 Carolyn Dr
- 1109 Sundance Dr
- 2090 E Central Ave
- 1100 S Elm St
- 429 Wilson Park Dr
- 1660 E Central Ave
- 609 Kings Cross Ct
- 1232 Hollyhill Dr
- 811 Maid Marion Ct
- 831 Maid Marion Ct
- 840 King Harry Place
- 850 King Harry Place
- 830 King Harry Place
- 841 Maid Marion Ct
- 2021 King Richard Pkwy
- 820 Maid Marion Ct
- 2101 King Richard Pkwy
- 824 King Harry Place
- 854 King Harry Place
- 2111 King Richard Pkwy
- 851 Maid Marion Ct
- 804 King Harry Place
- 841 King Harry Place
- 831 King Harry Place
- 815 Stout Will Ct
- 847 King Harry Place
- 819 Stout Will Ct
- 837 Stout Will Ct