821 Millbridge Ave Unit 71 Holland, MI 49423
Westside NeighborhoodEstimated Value: $230,000 - $259,000
2
Beds
2
Baths
1,216
Sq Ft
$200/Sq Ft
Est. Value
About This Home
This home is located at 821 Millbridge Ave Unit 71, Holland, MI 49423 and is currently estimated at $243,172, approximately $199 per square foot. 821 Millbridge Ave Unit 71 is a home located in Allegan County with nearby schools including Jefferson Elementary School, Holland High School, and South Side Christian School.
Ownership History
Date
Name
Owned For
Owner Type
Purchase Details
Closed on
Jan 21, 2021
Sold by
Schut Nancy
Bought by
Schut Nancy and Schut Christina
Current Estimated Value
Purchase Details
Closed on
Sep 12, 2017
Sold by
Derringer Cecil L and Derringer Linda
Bought by
Schut Nancy
Home Financials for this Owner
Home Financials are based on the most recent Mortgage that was taken out on this home.
Original Mortgage
$76,000
Outstanding Balance
$63,448
Interest Rate
3.89%
Mortgage Type
New Conventional
Estimated Equity
$179,724
Purchase Details
Closed on
Dec 28, 2006
Sold by
Peka Victor Trust
Bought by
Keeney Avery
Home Financials for this Owner
Home Financials are based on the most recent Mortgage that was taken out on this home.
Original Mortgage
$85,600
Interest Rate
6.16%
Mortgage Type
Unknown
Purchase Details
Closed on
Feb 24, 1999
Sold by
Victor Reka
Bought by
Victor Reka Trust
Purchase Details
Closed on
Sep 11, 1998
Bought by
Victor Reka
Purchase Details
Closed on
Sep 15, 1993
Sold by
Hoeksema James L Tru
Create a Home Valuation Report for This Property
The Home Valuation Report is an in-depth analysis detailing your home's value as well as a comparison with similar homes in the area
Home Values in the Area
Average Home Value in this Area
Purchase History
| Date | Buyer | Sale Price | Title Company |
|---|---|---|---|
| Schut Nancy | -- | None Available | |
| Schut Nancy | $95,000 | None Available | |
| Keeney Avery | $107,000 | Chicago Title | |
| Victor Reka Trust | -- | -- | |
| Victor Reka | $88,500 | -- | |
| -- | -- | -- |
Source: Public Records
Mortgage History
| Date | Status | Borrower | Loan Amount |
|---|---|---|---|
| Open | Schut Nancy | $76,000 | |
| Previous Owner | Keeney Avery | $85,600 |
Source: Public Records
Tax History Compared to Growth
Tax History
| Year | Tax Paid | Tax Assessment Tax Assessment Total Assessment is a certain percentage of the fair market value that is determined by local assessors to be the total taxable value of land and additions on the property. | Land | Improvement |
|---|---|---|---|---|
| 2025 | $3,833 | $110,600 | $15,000 | $95,600 |
| 2024 | -- | $101,100 | $15,000 | $86,100 |
| 2023 | $3,588 | $86,800 | $15,000 | $71,800 |
| 2022 | $3,424 | $74,000 | $11,000 | $63,000 |
| 2021 | $2,399 | $65,600 | $10,500 | $55,100 |
| 2020 | $2,296 | $62,300 | $62,300 | $0 |
| 2019 | $2,186 | $53,800 | $9,500 | $44,300 |
| 2018 | $2,186 | $51,100 | $9,500 | $41,600 |
| 2017 | $0 | $39,500 | $7,000 | $32,500 |
| 2016 | $0 | $39,500 | $7,000 | $32,500 |
| 2015 | -- | $39,500 | $7,000 | $32,500 |
| 2014 | -- | $34,400 | $6,000 | $28,400 |
| 2013 | -- | $32,200 | $6,000 | $26,200 |
Source: Public Records
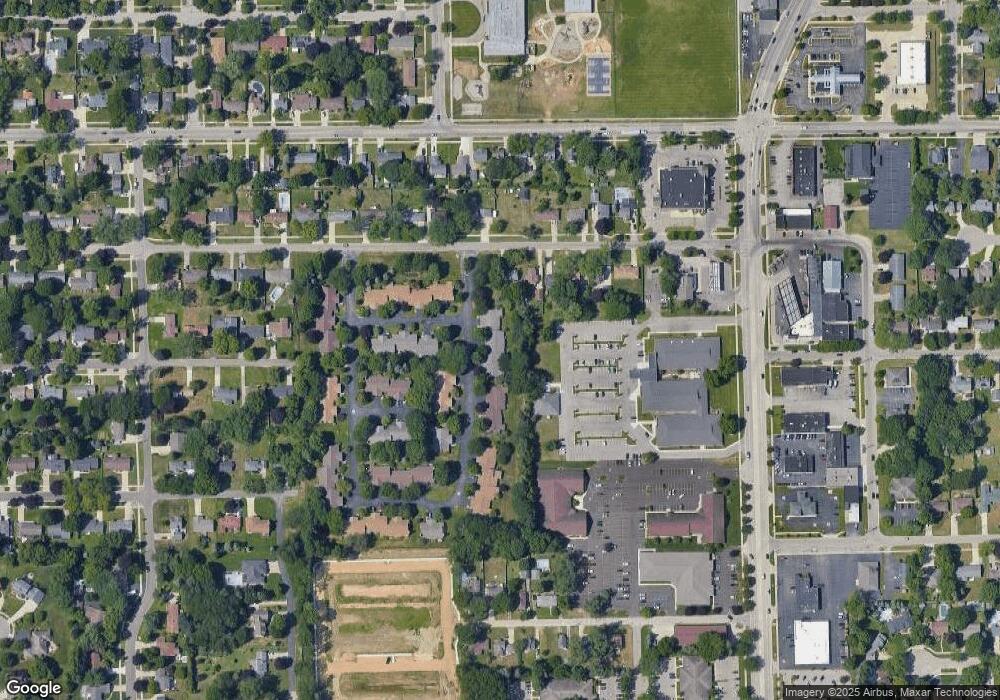
Map
Nearby Homes
- 834 Millbridge Ave Unit 56
- 860 York Ave
- 149 W 32nd St
- 155 W 31st St
- 135 W 31st St
- 253 W 28th St
- 333 W 28th St
- 401 Fairhill Ct
- 465 W 32nd St
- 1112 Fountain View Cir
- 91 W 40th St
- 1084 Fountain View Cir Unit 4
- 1087 Fountain View Cir Unit 3
- 828 Brook Village Dr
- 804 Brook Village Dr
- 94 Old Mill Dr Unit 16
- 337 W 22nd St
- 13 W 26th St
- 178 W 21st St
- 646 Spring Ln
- 819 Millbridge Ave
- 819 Millbridge Ave Unit 72
- 825 Millbridge Ave
- 827 Millbridge Ave
- 815 Millbridge Ave
- 10922 Fountain View Cir
- 10932 Fountain View Cir
- 10883 Fountain View Cir
- 10923 Fountain View Cir
- 10933 Fountain View Cir
- 813 Millbridge Ave Unit 74
- 833 Millbridge Ave Unit 68
- 835 Millbridge Ave Unit 67
- 828 Millbridge Ave Unit 58
- 830 Millbridge Ave
- 284 Chatham Ave
- 839 Millbridge Ave Unit 66
- 279 Chatham Ave
- 286 Chatham Ave
- 286 Chatham Ave Unit 11