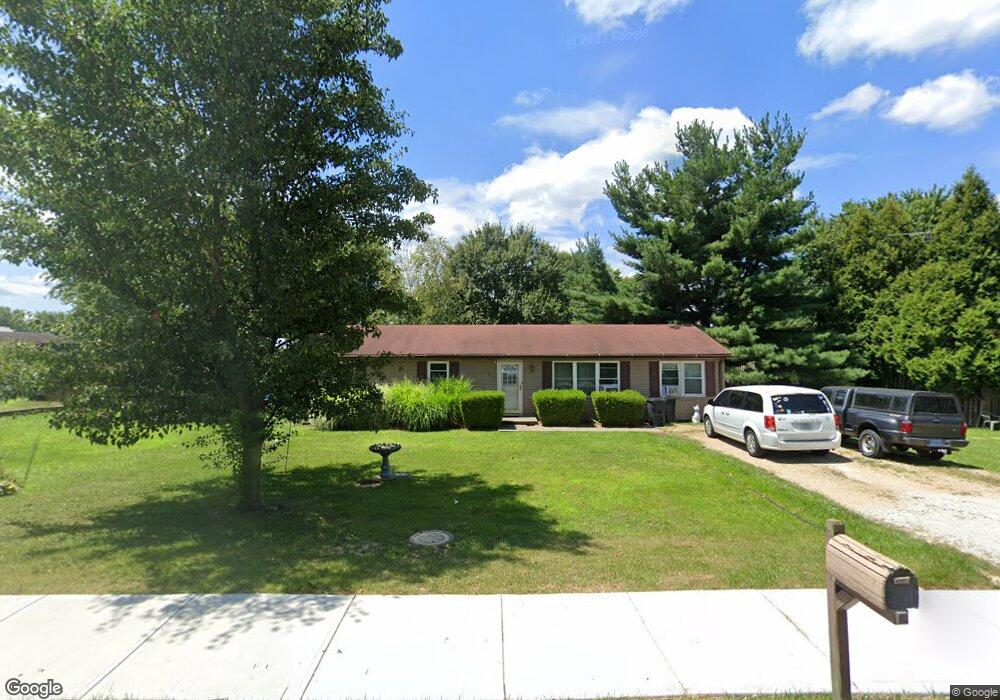
821 Morris St Osgood, IN 47037
Estimated Value: $156,000 - $181,000
2
Beds
1
Bath
1,056
Sq Ft
$159/Sq Ft
Est. Value
About This Home
This home is located at 821 Morris St, Osgood, IN 47037 and is currently estimated at $167,869, approximately $158 per square foot. 821 Morris St is a home located in Ripley County with nearby schools including Jac-Cen-Del Elementary School and Jac-Cen-Del Middle/High School.
Ownership History
Date
Name
Owned For
Owner Type
Purchase Details
Closed on
Dec 20, 2018
Sold by
Huntington Patricia A
Bought by
Kissell Joshua D
Current Estimated Value
Home Financials for this Owner
Home Financials are based on the most recent Mortgage that was taken out on this home.
Original Mortgage
$63,000
Outstanding Balance
$55,074
Interest Rate
4.9%
Mortgage Type
VA
Estimated Equity
$112,795
Purchase Details
Closed on
Jul 5, 2013
Sold by
Stephen D Huntington
Bought by
Patricia A Huntington
Create a Home Valuation Report for This Property
The Home Valuation Report is an in-depth analysis detailing your home's value as well as a comparison with similar homes in the area
Purchase History
| Date | Buyer | Sale Price | Title Company |
|---|---|---|---|
| Kissell Joshua D | $61,740 | Attorney Only | |
| Patricia A Huntington | -- | S.E Indiana Title Inc |
Source: Public Records
Mortgage History
| Date | Status | Borrower | Loan Amount |
|---|---|---|---|
| Open | Kissell Joshua D | $63,000 |
Source: Public Records
Tax History
| Year | Tax Paid | Tax Assessment Tax Assessment Total Assessment is a certain percentage of the fair market value that is determined by local assessors to be the total taxable value of land and additions on the property. | Land | Improvement |
|---|---|---|---|---|
| 2025 | -- | $88,600 | $10,200 | $78,400 |
| 2024 | -- | $74,900 | $10,200 | $64,700 |
| 2023 | $0 | $74,900 | $10,200 | $64,700 |
| 2022 | $0 | $76,400 | $10,200 | $66,200 |
| 2021 | $0 | $72,300 | $10,200 | $62,100 |
| 2020 | $305 | $72,300 | $10,200 | $62,100 |
| 2019 | $305 | $72,400 | $10,200 | $62,200 |
| 2018 | $305 | $72,400 | $10,200 | $62,200 |
| 2017 | $1,381 | $72,700 | $10,200 | $62,500 |
| 2016 | $1,264 | $72,700 | $10,200 | $62,500 |
| 2014 | $316 | $72,200 | $10,200 | $62,000 |
| 2013 | $316 | $74,800 | $10,200 | $64,600 |
Source: Public Records
Map
Nearby Homes
- 1011 S Shook St
- 405 S Walnut St
- 226 N Cardinal Ln
- 113 N Sycamore St
- 403 N Maple St
- 540 Columbia Ave
- 2051 W US Highway 50
- 0 David Ln
- 102 Gaslight Dr Unit 81
- 3639 W US Highway 50
- 1163 E Mud Pike Rd
- 206 E Perry St
- 1121 Sunset Strip
- 0 S Ridge Rd Unit 194860
- 0 S Ridge Rd Unit 202208
- 0 S Ridge Rd Unit 202211
- 0 S Ridge Rd Unit 202209
- 1213 W County Road 200 S
- 6216 U S 50
- 6519 W US Highway 50
Your Personal Tour Guide
Ask me questions while you tour the home.