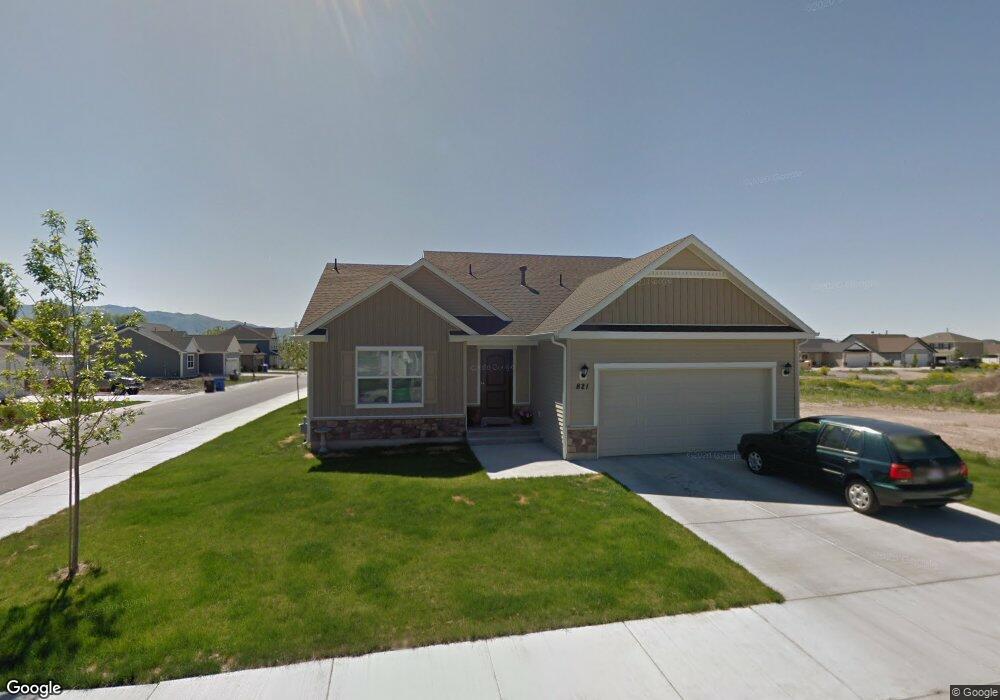
821 N 440 W Unit 69 Logan, UT 84321
Bridger NeighborhoodEstimated Value: $388,000 - $414,000
--
Bed
--
Bath
1,278
Sq Ft
$317/Sq Ft
Est. Value
About This Home
This home is located at 821 N 440 W Unit 69, Logan, UT 84321 and is currently estimated at $405,492, approximately $317 per square foot. 821 N 440 W Unit 69 is a home located in Cache County with nearby schools including Bridger School, Mount Logan Middle School, and Logan High School.
Ownership History
Date
Name
Owned For
Owner Type
Purchase Details
Closed on
Sep 7, 2011
Sold by
Chan Kim Srun and Chan Bunnath
Bought by
Chan Dany and Chan Bunnath
Current Estimated Value
Home Financials for this Owner
Home Financials are based on the most recent Mortgage that was taken out on this home.
Original Mortgage
$134,452
Outstanding Balance
$9,926
Interest Rate
4.26%
Mortgage Type
New Conventional
Estimated Equity
$395,566
Purchase Details
Closed on
May 26, 2011
Sold by
Ashbury Court Development 2 Llc
Bought by
Chan Kim Srun and Chan Bunnath
Home Financials for this Owner
Home Financials are based on the most recent Mortgage that was taken out on this home.
Original Mortgage
$130,000
Interest Rate
4.84%
Mortgage Type
Construction
Create a Home Valuation Report for This Property
The Home Valuation Report is an in-depth analysis detailing your home's value as well as a comparison with similar homes in the area
Home Values in the Area
Average Home Value in this Area
Purchase History
| Date | Buyer | Sale Price | Title Company |
|---|---|---|---|
| Chan Dany | -- | Cache Title Company | |
| Chan Kim Srun | -- | Cache Title Company |
Source: Public Records
Mortgage History
| Date | Status | Borrower | Loan Amount |
|---|---|---|---|
| Open | Chan Dany | $134,452 | |
| Closed | Chan Kim Srun | $130,000 |
Source: Public Records
Tax History Compared to Growth
Tax History
| Year | Tax Paid | Tax Assessment Tax Assessment Total Assessment is a certain percentage of the fair market value that is determined by local assessors to be the total taxable value of land and additions on the property. | Land | Improvement |
|---|---|---|---|---|
| 2025 | $1,744 | $225,500 | $0 | $0 |
| 2024 | $1,800 | $225,500 | $0 | $0 |
| 2023 | $1,881 | $224,620 | $0 | $0 |
| 2022 | $2,015 | $224,620 | $0 | $0 |
| 2021 | $1,590 | $273,840 | $42,000 | $231,840 |
| 2020 | $1,571 | $243,600 | $42,000 | $201,600 |
| 2019 | $1,642 | $243,600 | $42,000 | $201,600 |
| 2018 | $1,639 | $222,000 | $42,000 | $180,000 |
| 2017 | $1,495 | $107,030 | $0 | $0 |
| 2016 | $1,550 | $92,525 | $0 | $0 |
| 2015 | $1,341 | $92,525 | $0 | $0 |
| 2014 | $1,212 | $92,525 | $0 | $0 |
| 2013 | -- | $92,525 | $0 | $0 |
Source: Public Records
Map
Nearby Homes