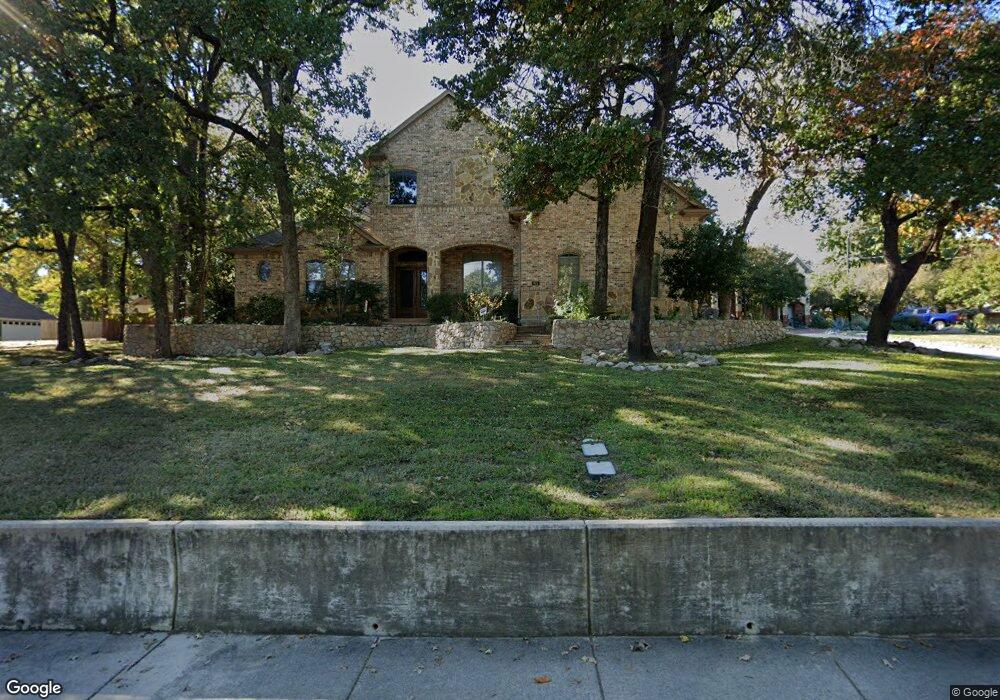
821 N Dove Rd Grapevine, TX 76051
Estimated Value: $849,000 - $1,228,000
4
Beds
4
Baths
4,749
Sq Ft
$221/Sq Ft
Est. Value
About This Home
This home is located at 821 N Dove Rd, Grapevine, TX 76051 and is currently estimated at $1,051,394, approximately $221 per square foot. 821 N Dove Rd is a home located in Tarrant County with nearby schools including Silver Lake Elementary School, Grapevine Middle, and Southlake Montessori.
Ownership History
Date
Name
Owned For
Owner Type
Purchase Details
Closed on
Jul 11, 2019
Sold by
Shrimankar Atul P and Shrimankar Sujata A
Bought by
Shrimankar Atul P and Shrimankar Sujata A
Current Estimated Value
Purchase Details
Closed on
Mar 28, 2017
Sold by
Hts San Antonio Lp
Bought by
Shrimankar Sujata and Shrimankar Atul
Home Financials for this Owner
Home Financials are based on the most recent Mortgage that was taken out on this home.
Original Mortgage
$37,791
Outstanding Balance
$31,465
Interest Rate
4.23%
Estimated Equity
$1,019,929
Purchase Details
Closed on
Aug 4, 2008
Sold by
Otten Raymond and Otten Christine
Bought by
Shrimankar Atul and Shrimankar Sujata
Purchase Details
Closed on
Dec 2, 2002
Sold by
Mclellan Jerry A and Mclellan Karen M
Bought by
Otten Raymond
Home Financials for this Owner
Home Financials are based on the most recent Mortgage that was taken out on this home.
Original Mortgage
$60,000
Interest Rate
6.13%
Mortgage Type
Seller Take Back
Create a Home Valuation Report for This Property
The Home Valuation Report is an in-depth analysis detailing your home's value as well as a comparison with similar homes in the area
Home Values in the Area
Average Home Value in this Area
Purchase History
| Date | Buyer | Sale Price | Title Company |
|---|---|---|---|
| Shrimankar Atul P | -- | None Available | |
| Shrimankar Sujata | -- | -- | |
| Shrimankar Atul | -- | Landam | |
| Otten Raymond | -- | Republic Title |
Source: Public Records
Mortgage History
| Date | Status | Borrower | Loan Amount |
|---|---|---|---|
| Open | Shrimankar Sujata | $37,791 | |
| Closed | Shrimankar Sujata | -- | |
| Previous Owner | Otten Raymond | $60,000 |
Source: Public Records
Tax History Compared to Growth
Tax History
| Year | Tax Paid | Tax Assessment Tax Assessment Total Assessment is a certain percentage of the fair market value that is determined by local assessors to be the total taxable value of land and additions on the property. | Land | Improvement |
|---|---|---|---|---|
| 2025 | $2,537 | $793,487 | $198,126 | $595,361 |
| 2024 | $2,537 | $900,000 | $198,126 | $701,874 |
| 2023 | $9,497 | $830,000 | $66,720 | $763,280 |
| 2022 | $10,203 | $515,000 | $66,720 | $448,280 |
| 2021 | $11,198 | $515,000 | $66,720 | $448,280 |
| 2020 | $12,102 | $550,200 | $66,720 | $483,480 |
| 2019 | $12,547 | $550,201 | $66,720 | $483,481 |
| 2018 | $3,139 | $527,986 | $66,720 | $461,266 |
| 2017 | $11,761 | $847,798 | $66,720 | $781,078 |
| 2016 | $10,692 | $778,548 | $66,720 | $711,828 |
| 2015 | $9,164 | $420,300 | $36,000 | $384,300 |
| 2014 | $9,164 | $420,300 | $36,000 | $384,300 |
Source: Public Records
Map
Nearby Homes
- 1507 Country Forest Ct
- 1201 Circle View Ct
- 1508 Bennington Ct
- 1002 Meadow Bend Loop N
- 841 Meadow Bend Loop W
- 6007 Laurel Ln
- 6011 Laurel Ln
- 517 Yellowstone Dr
- 305 Tillery Cir
- 1626 Choteau Cir
- 1916 Everglade Ct
- 2081 Holt Way
- 1323 Dublin St
- 2092 Holt Way
- 1641 Choteau Cir
- 1654 Choteau Cir
- 1092 Rosewood Dr
- 2140 S Winding Creek Dr
- 1723 Autumn Ridge Ln
- 460 Caviness Dr
- 825 N Dove Rd
- 813 N Dove Rd
- 832 Lake Forest Ct
- 600 N Dove Rd
- 606 N Dove Rd
- 826 Lake Forest Ct
- 820 Lake Forest Ct
- 838 Lake Forest Ct
- 1421 Overlook Dr
- 814 Lake Forest Ct
- 1402 Tiffany Forest Ln
- 1408 Tiffany Forest Ln
- 1414 Tiffany Forest Ln
- 1505 Overlook Dr
- 904 Harber Ave
- 808 Lake Forest Ct
- 902 N Dove Rd
- 1508 Country Forest Ct
- 1513 Overlook Dr
- 844 Lake Forest Ct