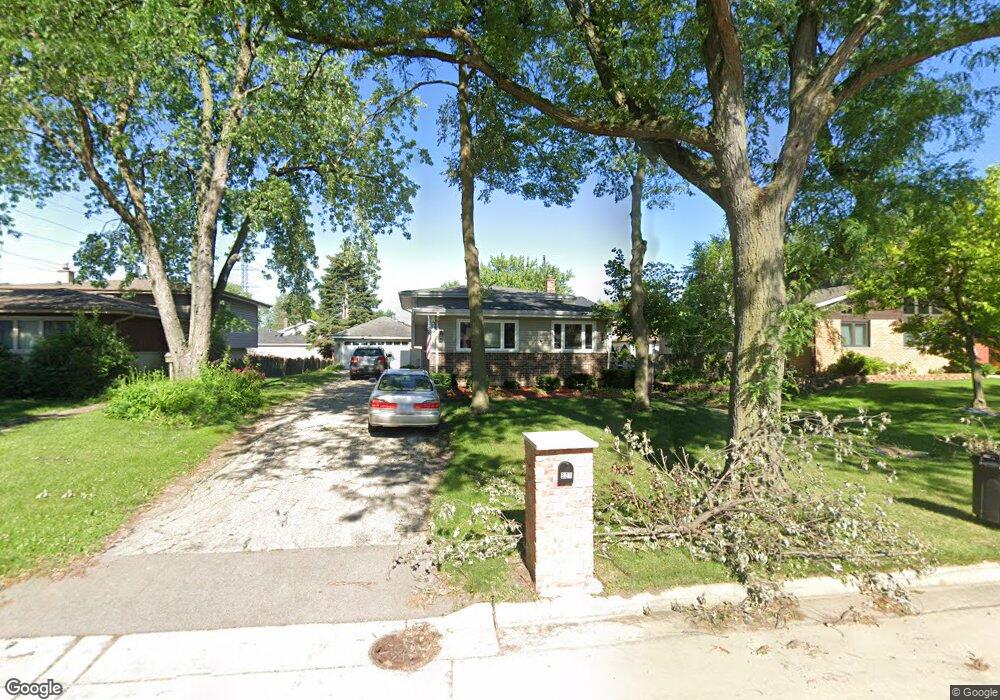
821 N Howard Ave Elmhurst, IL 60126
Estimated Value: $366,000 - $462,000
3
Beds
2
Baths
1,810
Sq Ft
$232/Sq Ft
Est. Value
About This Home
This home is located at 821 N Howard Ave, Elmhurst, IL 60126 and is currently estimated at $419,561, approximately $231 per square foot. 821 N Howard Ave is a home located in DuPage County with nearby schools including Conrad Fischer Elementary School, Churchville Middle School, and York Community High School.
Ownership History
Date
Name
Owned For
Owner Type
Purchase Details
Closed on
Feb 11, 2005
Sold by
Ikis Anthony and Ikis Jessica
Bought by
Raimondi Vito and Raimondi Carol
Current Estimated Value
Home Financials for this Owner
Home Financials are based on the most recent Mortgage that was taken out on this home.
Original Mortgage
$274,400
Outstanding Balance
$148,088
Interest Rate
6.7%
Mortgage Type
Purchase Money Mortgage
Estimated Equity
$271,473
Purchase Details
Closed on
Jun 27, 2003
Sold by
Craig Patricia A
Bought by
Ikis Anthony and Ikis Jessica
Home Financials for this Owner
Home Financials are based on the most recent Mortgage that was taken out on this home.
Original Mortgage
$268,650
Interest Rate
5.3%
Mortgage Type
Purchase Money Mortgage
Purchase Details
Closed on
Mar 12, 2003
Sold by
Craig Richard M
Bought by
Craig Patricia
Create a Home Valuation Report for This Property
The Home Valuation Report is an in-depth analysis detailing your home's value as well as a comparison with similar homes in the area
Home Values in the Area
Average Home Value in this Area
Purchase History
| Date | Buyer | Sale Price | Title Company |
|---|---|---|---|
| Raimondi Vito | $343,000 | Multiple | |
| Ikis Anthony | $277,000 | Stewart Title Company | |
| Craig Patricia | -- | -- |
Source: Public Records
Mortgage History
| Date | Status | Borrower | Loan Amount |
|---|---|---|---|
| Open | Raimondi Vito | $274,400 | |
| Previous Owner | Ikis Anthony | $268,650 | |
| Closed | Raimondi Vito | $68,600 |
Source: Public Records
Tax History Compared to Growth
Tax History
| Year | Tax Paid | Tax Assessment Tax Assessment Total Assessment is a certain percentage of the fair market value that is determined by local assessors to be the total taxable value of land and additions on the property. | Land | Improvement |
|---|---|---|---|---|
| 2024 | $6,984 | $124,042 | $52,671 | $71,371 |
| 2023 | $6,420 | $114,030 | $48,420 | $65,610 |
| 2022 | $6,191 | $109,070 | $46,330 | $62,740 |
| 2021 | $5,918 | $104,480 | $44,380 | $60,100 |
| 2020 | $5,559 | $100,080 | $42,510 | $57,570 |
| 2019 | $5,493 | $96,230 | $40,870 | $55,360 |
| 2018 | $5,084 | $89,170 | $38,920 | $50,250 |
| 2017 | $4,974 | $85,230 | $37,200 | $48,030 |
| 2016 | $4,745 | $78,690 | $34,350 | $44,340 |
| 2015 | $4,630 | $72,690 | $31,730 | $40,960 |
| 2014 | $4,394 | $64,440 | $30,800 | $33,640 |
| 2013 | $4,383 | $65,760 | $31,430 | $34,330 |
Source: Public Records
Map
Nearby Homes
- 281 E North End Ave
- 791 N Adele St
- 3N276 N Howard Ave
- 841 N York St Unit 101
- 841 N York St Unit 332
- 841 N York St Unit 129
- 3N425 N Howard Ave
- 738 N Parker St
- 728 N Parker St
- 634 N Kenilworth Ave
- 909 N Addison Ave
- 1043 S York Rd Unit 209
- 1043 S York Rd Unit 208
- 1043 S York Rd Unit 411
- 1043 S York Rd Unit 605
- 26 King Arthur Ct Unit 4
- 128 David Dr
- 23 King Arthur Ct Unit 6
- 251 W Armitage Ave
- 35 King Arthur Ct Unit 19
- 825 N Howard Ave
- 815 N Howard Ave
- 829 N Howard Ave
- 811 N Howard Ave
- 828 N Emroy Ave
- 824 N Emroy Ave
- 832 N Emroy Ave
- 826 N Howard Ave
- 836 N Emroy Ave
- 267 E North End Ave
- 822 N Howard Ave
- 818 N Emroy Ave
- 818 N Howard Ave
- 834 N Howard Ave
- 812 N Howard Ave
- 253 E North End Ave
- 266 E North End Ave
- 827 N Emroy Ave
- 823 N Emroy Ave
- 831 N Emroy Ave