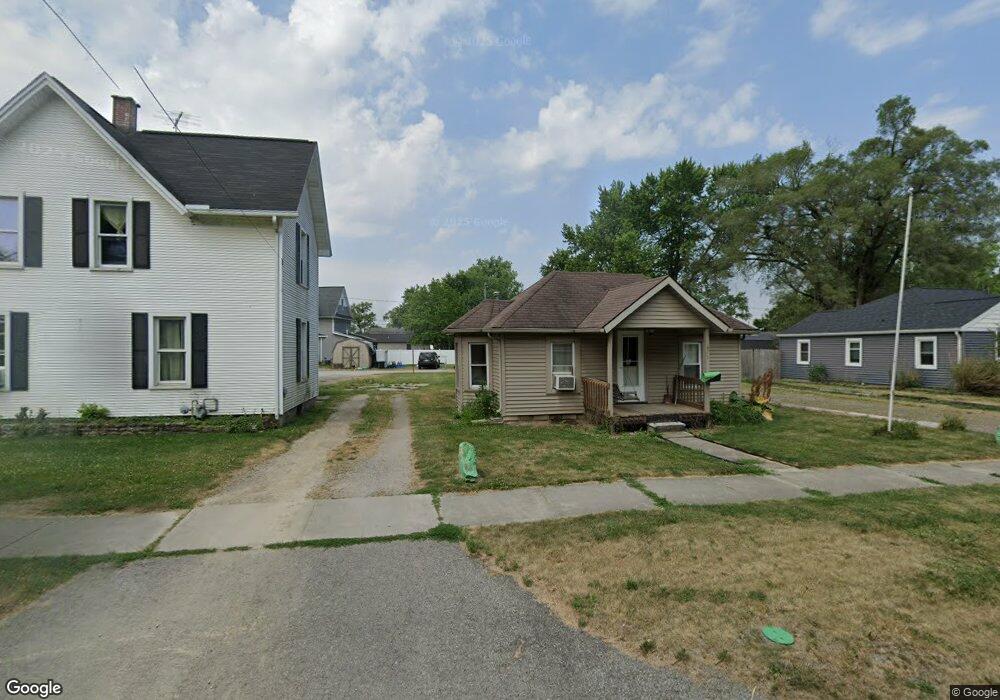
821 N Ottokee St Wauseon, OH 43567
Estimated Value: $105,000 - $126,126
2
Beds
1
Bath
1,022
Sq Ft
$112/Sq Ft
Est. Value
About This Home
This home is located at 821 N Ottokee St, Wauseon, OH 43567 and is currently estimated at $114,282, approximately $111 per square foot. 821 N Ottokee St is a home located in Fulton County with nearby schools including Wauseon Primary School, Wauseon Elementary School, and Wauseon Middle School.
Ownership History
Date
Name
Owned For
Owner Type
Purchase Details
Closed on
Nov 12, 2009
Sold by
Kretz James E and Kretz Jill
Bought by
Mock Joseph W
Current Estimated Value
Purchase Details
Closed on
Aug 29, 2007
Sold by
Kretz Jamie L
Bought by
Kretz James E
Purchase Details
Closed on
Dec 23, 2005
Sold by
Mock Joseph W and Buehrer Monica R
Bought by
Kretz James E and Kretz Jamie L
Home Financials for this Owner
Home Financials are based on the most recent Mortgage that was taken out on this home.
Original Mortgage
$69,600
Interest Rate
6.4%
Mortgage Type
Purchase Money Mortgage
Purchase Details
Closed on
Apr 3, 2000
Sold by
Pontious Richard
Bought by
Mock Joseph W
Home Financials for this Owner
Home Financials are based on the most recent Mortgage that was taken out on this home.
Original Mortgage
$60,373
Interest Rate
8.39%
Mortgage Type
New Conventional
Purchase Details
Closed on
Dec 16, 1997
Sold by
Est Kenneth E Pontious
Bought by
Pontious Richard L
Purchase Details
Closed on
Jan 1, 1990
Bought by
Pontious Kenneth E
Create a Home Valuation Report for This Property
The Home Valuation Report is an in-depth analysis detailing your home's value as well as a comparison with similar homes in the area
Home Values in the Area
Average Home Value in this Area
Purchase History
| Date | Buyer | Sale Price | Title Company |
|---|---|---|---|
| Mock Joseph W | $28,000 | Attorney | |
| Kretz James E | -- | Attorney | |
| Kretz James E | $87,000 | None Available | |
| Mock Joseph W | $60,000 | -- | |
| Pontious Richard L | $30,000 | -- | |
| Pontious Kenneth E | -- | -- |
Source: Public Records
Mortgage History
| Date | Status | Borrower | Loan Amount |
|---|---|---|---|
| Previous Owner | Kretz James E | $69,600 | |
| Previous Owner | Mock Joseph W | $60,373 | |
| Closed | Pontious Richard L | -- |
Source: Public Records
Tax History Compared to Growth
Tax History
| Year | Tax Paid | Tax Assessment Tax Assessment Total Assessment is a certain percentage of the fair market value that is determined by local assessors to be the total taxable value of land and additions on the property. | Land | Improvement |
|---|---|---|---|---|
| 2024 | $1,665 | $32,770 | $6,760 | $26,010 |
| 2023 | $1,665 | $32,770 | $6,760 | $26,010 |
| 2022 | $1,488 | $24,890 | $5,640 | $19,250 |
| 2021 | $1,541 | $24,890 | $5,640 | $19,250 |
| 2020 | $1,429 | $24,890 | $5,640 | $19,250 |
| 2019 | $1,420 | $24,370 | $5,640 | $18,730 |
| 2018 | $1,250 | $24,370 | $5,640 | $18,730 |
| 2017 | $1,234 | $24,370 | $5,640 | $18,730 |
| 2016 | $1,205 | $21,290 | $5,640 | $15,650 |
| 2015 | $1,129 | $21,290 | $5,640 | $15,650 |
| 2014 | $1,074 | $21,290 | $5,640 | $15,650 |
| 2013 | $1,336 | $24,510 | $5,080 | $19,430 |
Source: Public Records
Map
Nearby Homes
- 227 Wabash St
- 428 N Brunell St
- 351 E Walnut St
- 217 Marshall St
- 139 Marshall St
- 1270 S Park Ln
- 527 E Elm St
- 234 W Chestnut St
- 252 W Chestnut St
- 524 E Elm St
- 125 Cherry St
- 1285 N Shoop Ave
- 1338 N Park Ln
- 00 Glenwood
- 0 Glenwood Unit 6124946
- 420 Clover Ln
- 840 Pine St
- 622 Vine St
- 303 Eastwood St
- 14578 Us Highway 20a
- 825 N Ottokee St
- 815 N Ottokee St
- 218 W Willow St
- 831 N Ottokee St
- 225 Maple St
- 222 W Willow St
- 812 N Ottokee St
- 824 N Ottokee St
- 122 W Willow St
- 903 N Ottokee St
- 234 W Willow St
- 830 N Ottokee St
- 227 Maple St
- 209 W Willow St
- 0 N Ottokee St Unit 5048717
- 0 N Ottokee St Unit 5059984
- 236 W Willow St
- 211 W Willow St
- 904 N Ottokee St
- 217 W Willow St