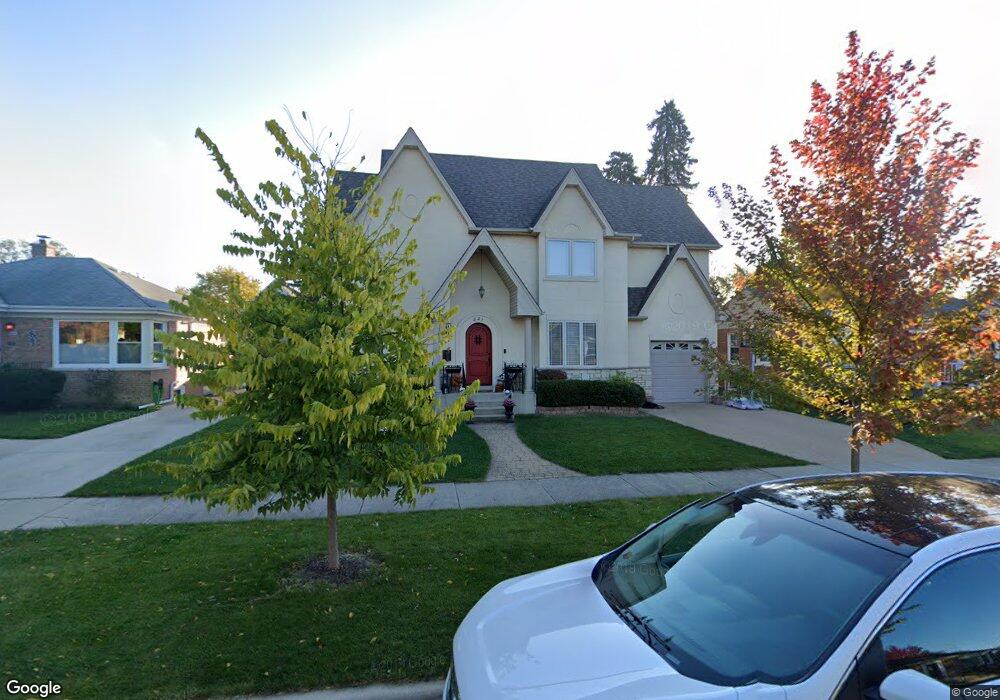
821 Newberry Ave La Grange Park, IL 60526
Estimated Value: $683,000 - $783,000
5
Beds
4
Baths
2,859
Sq Ft
$253/Sq Ft
Est. Value
About This Home
This home is located at 821 Newberry Ave, La Grange Park, IL 60526 and is currently estimated at $722,824, approximately $252 per square foot. 821 Newberry Ave is a home located in Cook County with nearby schools including Forest Road Elementary School, Park Junior High School, and Lyons Township High School.
Ownership History
Date
Name
Owned For
Owner Type
Purchase Details
Closed on
Apr 30, 2007
Sold by
Maka Mary
Bought by
Barden Christian A and Gawel Susan H
Current Estimated Value
Home Financials for this Owner
Home Financials are based on the most recent Mortgage that was taken out on this home.
Original Mortgage
$470,000
Outstanding Balance
$286,354
Interest Rate
6.2%
Mortgage Type
Unknown
Estimated Equity
$436,470
Purchase Details
Closed on
Mar 16, 2006
Sold by
Mccarty David W and Mccarty Cynthia L
Bought by
Maka Mary
Purchase Details
Closed on
Mar 30, 1998
Sold by
Chvila Miles L and Chvila Diane F
Bought by
Mccarty David W and Mccarty Cynthia L
Home Financials for this Owner
Home Financials are based on the most recent Mortgage that was taken out on this home.
Original Mortgage
$122,150
Interest Rate
6.95%
Mortgage Type
FHA
Purchase Details
Closed on
Jun 28, 1995
Sold by
Hartman Dorothy B
Bought by
Hartman Dorothy B and Meadows Linda L
Create a Home Valuation Report for This Property
The Home Valuation Report is an in-depth analysis detailing your home's value as well as a comparison with similar homes in the area
Home Values in the Area
Average Home Value in this Area
Purchase History
| Date | Buyer | Sale Price | Title Company |
|---|---|---|---|
| Barden Christian A | $620,000 | Git | |
| Maka Mary | $255,000 | Multiple | |
| Mccarty David W | $124,000 | -- | |
| Hartman Dorothy B | -- | -- |
Source: Public Records
Mortgage History
| Date | Status | Borrower | Loan Amount |
|---|---|---|---|
| Open | Barden Christian A | $470,000 | |
| Previous Owner | Mccarty David W | $122,150 |
Source: Public Records
Tax History Compared to Growth
Tax History
| Year | Tax Paid | Tax Assessment Tax Assessment Total Assessment is a certain percentage of the fair market value that is determined by local assessors to be the total taxable value of land and additions on the property. | Land | Improvement |
|---|---|---|---|---|
| 2024 | $13,966 | $58,000 | $5,250 | $52,750 |
| 2023 | $10,930 | $58,000 | $5,250 | $52,750 |
| 2022 | $10,930 | $39,343 | $4,500 | $34,843 |
| 2021 | $10,532 | $39,343 | $4,500 | $34,843 |
| 2020 | $10,350 | $39,343 | $4,500 | $34,843 |
| 2019 | $11,339 | $43,246 | $4,125 | $39,121 |
| 2018 | $11,146 | $43,246 | $4,125 | $39,121 |
| 2017 | $10,870 | $43,246 | $4,125 | $39,121 |
| 2016 | $8,728 | $31,387 | $3,750 | $27,637 |
| 2015 | $7,813 | $31,387 | $3,750 | $27,637 |
| 2014 | $7,708 | $31,387 | $3,750 | $27,637 |
| 2013 | $7,900 | $32,814 | $3,750 | $29,064 |
Source: Public Records
Map
Nearby Homes
- 9532 Jackson Ave
- 9532 Lexington Ave
- 3251 Grand Blvd
- 3336 Grand Blvd
- 525 Homestead Rd
- 3128 Arthur Ave
- 314 E 31st St
- 3229 Maple Ave
- 818 N La Grange Rd
- 1245 Morgan Ave
- 326 Kemman Ave
- 3800 Harrison Ave
- 314 Beach Ave
- 1427 Cleveland Ave
- 1436 Kemman Ave
- 1427 Homestead Rd Unit H
- 1445 Morgan Ave
- 1518 Cleveland Ave
- 3417 Oak Ave
- 3108 Oak Ave
- 825 Newberry Ave
- 817 Newberry Ave
- 831 Newberry Ave
- 813 Newberry Ave
- 822 Kemman Ave
- 816 Kemman Ave
- 826 Kemman Ave
- 812 Kemman Ave
- 828 Kemman Ave
- 835 Newberry Ave
- 809 Newberry Ave
- 820 Newberry Ave
- 824 Newberry Ave
- 816 Newberry Ave
- 808 Kemman Ave
- 832 Kemman Ave
- 828 Newberry Ave
- 812 Newberry Ave
- 805 Newberry Ave
- 837 Newberry Ave