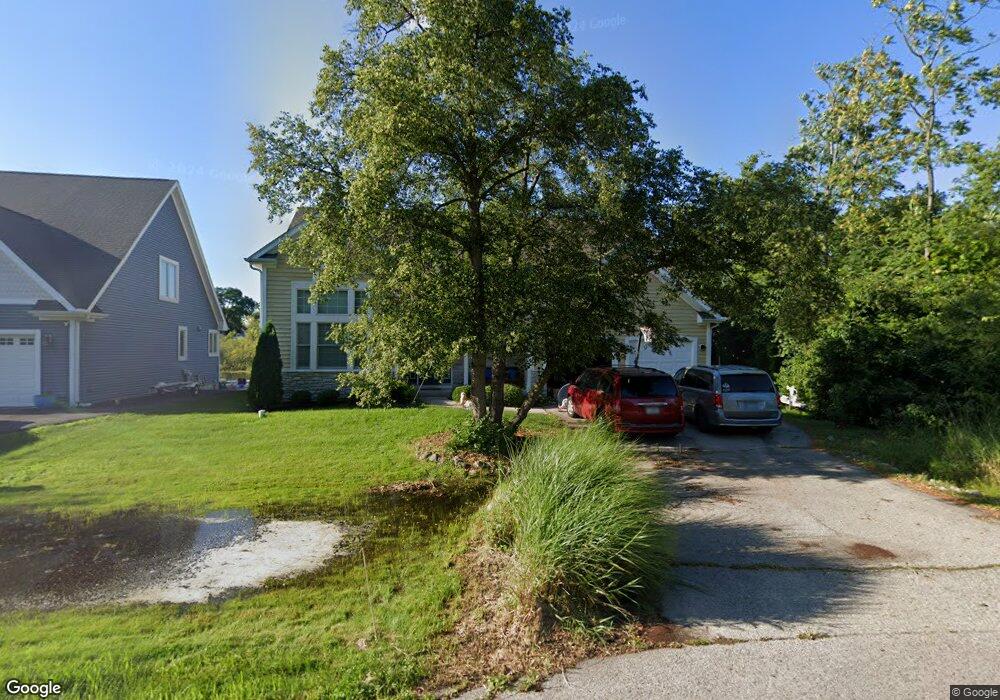
821 Northshore Dr Wauconda, IL 60084
Estimated Value: $521,408 - $649,000
3
Beds
3
Baths
2,800
Sq Ft
$207/Sq Ft
Est. Value
About This Home
This home is located at 821 Northshore Dr, Wauconda, IL 60084 and is currently estimated at $579,852, approximately $207 per square foot. 821 Northshore Dr is a home located in Lake County with nearby schools including Wauconda Grade School, Wauconda Middle School, and Wauconda High School.
Ownership History
Date
Name
Owned For
Owner Type
Purchase Details
Closed on
Jun 7, 2005
Sold by
Jbj Development Llc
Bought by
Zuniga Michael L and Zuniga Nicole
Current Estimated Value
Home Financials for this Owner
Home Financials are based on the most recent Mortgage that was taken out on this home.
Original Mortgage
$88,500
Interest Rate
5.43%
Mortgage Type
Stand Alone Second
Purchase Details
Closed on
Mar 23, 2004
Sold by
Kiessling Robert D and Sheridan James P
Bought by
Jbj Development Llc
Purchase Details
Closed on
Jun 20, 2002
Sold by
Dodds Lillian C
Bought by
Wojton Joseph and Kiessling Robert
Purchase Details
Closed on
Sep 15, 1997
Sold by
Richtman John P and Rambousek Frank
Bought by
Dobbs Lillian C
Purchase Details
Closed on
Jul 24, 1997
Sold by
Grand Premier Trust & Investment Inc
Bought by
Rambousek Frank
Create a Home Valuation Report for This Property
The Home Valuation Report is an in-depth analysis detailing your home's value as well as a comparison with similar homes in the area
Home Values in the Area
Average Home Value in this Area
Purchase History
| Date | Buyer | Sale Price | Title Company |
|---|---|---|---|
| Zuniga Michael L | $442,500 | Ct | |
| Jbj Development Llc | -- | -- | |
| Wojton Joseph | $72,500 | Burnet Title Llc | |
| Dobbs Lillian C | -- | -- | |
| Rambousek Frank | -- | -- |
Source: Public Records
Mortgage History
| Date | Status | Borrower | Loan Amount |
|---|---|---|---|
| Closed | Zuniga Michael L | $88,500 | |
| Previous Owner | Zuniga Michael L | $354,000 |
Source: Public Records
Tax History Compared to Growth
Tax History
| Year | Tax Paid | Tax Assessment Tax Assessment Total Assessment is a certain percentage of the fair market value that is determined by local assessors to be the total taxable value of land and additions on the property. | Land | Improvement |
|---|---|---|---|---|
| 2024 | $11,837 | $140,547 | $37,482 | $103,065 |
| 2023 | $12,095 | $128,470 | $34,261 | $94,209 |
| 2022 | $12,095 | $116,843 | $29,675 | $87,168 |
| 2021 | $11,556 | $110,406 | $28,040 | $82,366 |
| 2020 | $11,196 | $105,229 | $26,725 | $78,504 |
| 2019 | $9,954 | $99,451 | $25,258 | $74,193 |
| 2018 | $9,412 | $87,860 | $29,950 | $57,910 |
| 2017 | $9,405 | $86,844 | $29,604 | $57,240 |
| 2016 | $8,836 | $82,239 | $28,034 | $54,205 |
| 2015 | $8,310 | $75,497 | $25,736 | $49,761 |
| 2014 | $9,859 | $83,238 | $29,564 | $53,674 |
| 2012 | $9,589 | $90,441 | $28,285 | $62,156 |
Source: Public Records
Map
Nearby Homes
- 0 Bonner Rd
- 701 Lake Shore Dr
- 1260 Water Stone Cir
- 419 Hill St Unit 2805
- 28177 N Garland Rd
- 302 Stillwater Ct Unit 1702
- 303 Stillwater Ct Unit 1106
- 309 Stillwater Ct Unit 1101
- 26049 N Il Route 59
- 315 Hill St Unit A
- 28855 N Garland Rd
- 325 Sundown Ct Unit B
- 310 Sundown Ct Unit E
- 29564 N Garland Rd
- 136 Parkview Dr Unit 5136
- 26241 W Bonner Rd
- 225 Regency Ct Unit A
- 235 Regency Ct Unit B
- 450 N Main St Unit S307A
- 450 N Main St Unit S208A
- 817 Northshore Dr
- 1004 Jackson Ave
- 815 Northshore Dr
- 1000 Jackson Ave
- 950 Jackson Ave
- 930 Adams St
- 930 Adams Ave
- 811 Northshore Dr
- 924 Adams Ave
- 928 Jackson Ave
- 923 Jackson Ave
- 924 Adams St
- 920 Jackson Ave
- 921 Jackson Ave
- 808 Northshore Dr
- 920 Adams St
- 919 Jackson Ave
- 1002 Monroe St
- 923 Adams Ave
- 918 Jackson Ave