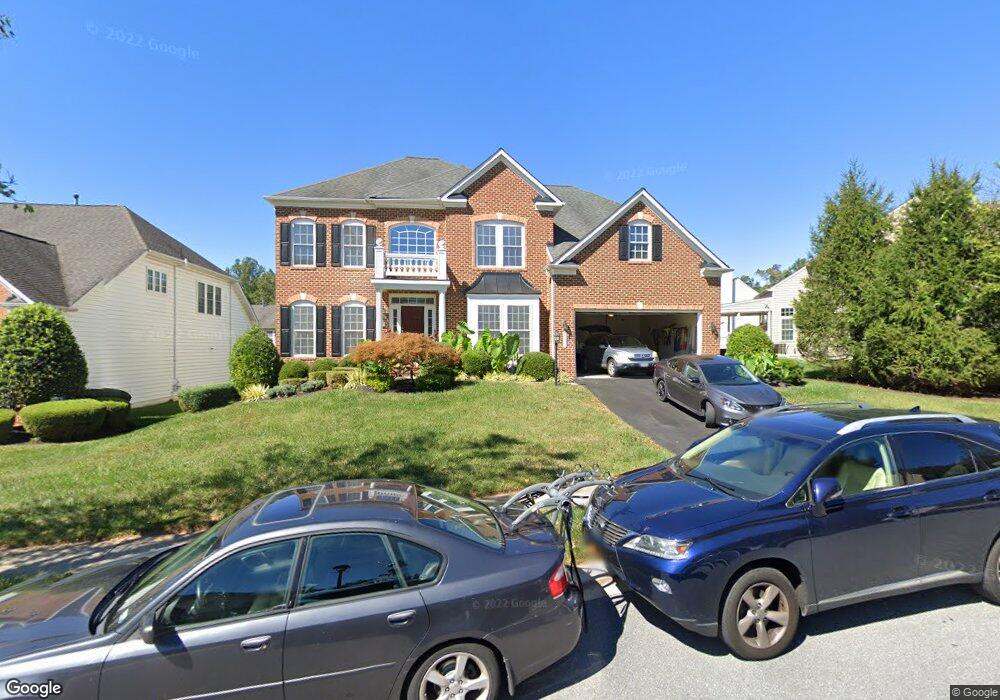
821 Queens Park Dr Owings Mills, MD 21117
Estimated Value: $814,000 - $909,000
--
Bed
5
Baths
4,124
Sq Ft
$209/Sq Ft
Est. Value
About This Home
This home is located at 821 Queens Park Dr, Owings Mills, MD 21117 and is currently estimated at $863,647, approximately $209 per square foot. 821 Queens Park Dr is a home located in Baltimore County with nearby schools including Timber Grove Elementary, Franklin Middle, and Franklin High.
Ownership History
Date
Name
Owned For
Owner Type
Purchase Details
Closed on
Dec 13, 2006
Sold by
Curry Patrice N
Bought by
Spencer Christopher and Spencer Micheele
Current Estimated Value
Home Financials for this Owner
Home Financials are based on the most recent Mortgage that was taken out on this home.
Original Mortgage
$109,500
Outstanding Balance
$64,979
Interest Rate
6.36%
Mortgage Type
Stand Alone Second
Estimated Equity
$798,668
Purchase Details
Closed on
Nov 15, 2006
Sold by
Curry Patrice N
Bought by
Spencer Christopher and Spencer Micheele
Home Financials for this Owner
Home Financials are based on the most recent Mortgage that was taken out on this home.
Original Mortgage
$109,500
Outstanding Balance
$64,979
Interest Rate
6.36%
Mortgage Type
Stand Alone Second
Estimated Equity
$798,668
Purchase Details
Closed on
Nov 14, 2003
Sold by
Nvr Inc
Bought by
Curry Patrice N and Curry Keith
Create a Home Valuation Report for This Property
The Home Valuation Report is an in-depth analysis detailing your home's value as well as a comparison with similar homes in the area
Home Values in the Area
Average Home Value in this Area
Purchase History
| Date | Buyer | Sale Price | Title Company |
|---|---|---|---|
| Spencer Christopher | $730,000 | -- | |
| Spencer Christopher | $730,000 | -- | |
| Curry Patrice N | $584,090 | -- |
Source: Public Records
Mortgage History
| Date | Status | Borrower | Loan Amount |
|---|---|---|---|
| Open | Spencer Christopher | $109,500 | |
| Open | Spencer Christopher | $584,000 | |
| Closed | Spencer Christopher | $109,500 | |
| Closed | Spencer Christopher | $584,000 |
Source: Public Records
Tax History Compared to Growth
Tax History
| Year | Tax Paid | Tax Assessment Tax Assessment Total Assessment is a certain percentage of the fair market value that is determined by local assessors to be the total taxable value of land and additions on the property. | Land | Improvement |
|---|---|---|---|---|
| 2025 | $8,067 | $656,567 | -- | -- |
| 2024 | $8,067 | $584,800 | $127,100 | $457,700 |
| 2023 | $4,042 | $577,300 | $0 | $0 |
| 2022 | $7,711 | $569,800 | $0 | $0 |
| 2021 | $7,488 | $562,300 | $127,100 | $435,200 |
| 2020 | $7,488 | $546,833 | $0 | $0 |
| 2019 | $7,373 | $531,367 | $0 | $0 |
| 2018 | $7,005 | $515,900 | $127,100 | $388,800 |
| 2017 | $6,811 | $499,267 | $0 | $0 |
| 2016 | $6,795 | $482,633 | $0 | $0 |
| 2015 | $6,795 | $466,000 | $0 | $0 |
| 2014 | $6,795 | $466,000 | $0 | $0 |
Source: Public Records
Map
Nearby Homes
- 923A Academy Ave
- 923 Academy Ave
- 921 Academy Ave
- 25 Samantha Ct
- 21 Samantha Ct
- 610 Academy Ave
- 805 Joshua Tree Ct
- 604 Academy Ave
- 970 Joshua Tree Ct
- 39 Legacy Dr
- 452 Doe Meadow Dr
- 37 Blue Sky Dr
- 301 Kearney Dr
- 202 Embleton Rd
- 14 Oak Hill Ct
- 331 Bryanstone Rd
- 14 Golden Grass Ct
- 318 Bryanstone Rd
- 10 Wensley Dale Ct
- 4 Romney Ct
- 823 Queens Park Dr
- 819 Queens Park Dr
- 815 Queens Park Dr
- 813 Queens Park Dr
- 817 Queens Park Dr
- 825 Queens Park Dr
- 828 Queens Park Dr
- 832 Queens Park Dr
- 830 Queens Park Dr
- 834 Queens Park Dr
- 811 Queens Park Dr
- 826 Queens Park Dr
- 827 Queens Park Dr
- 836 Queens Park Dr
- 824 Queens Park Dr
- 812 Queens Park Dr
- 822 Queens Park Dr
- 814 Queens Park Dr
- 809 Queens Park Dr
- 816 Queens Park Dr