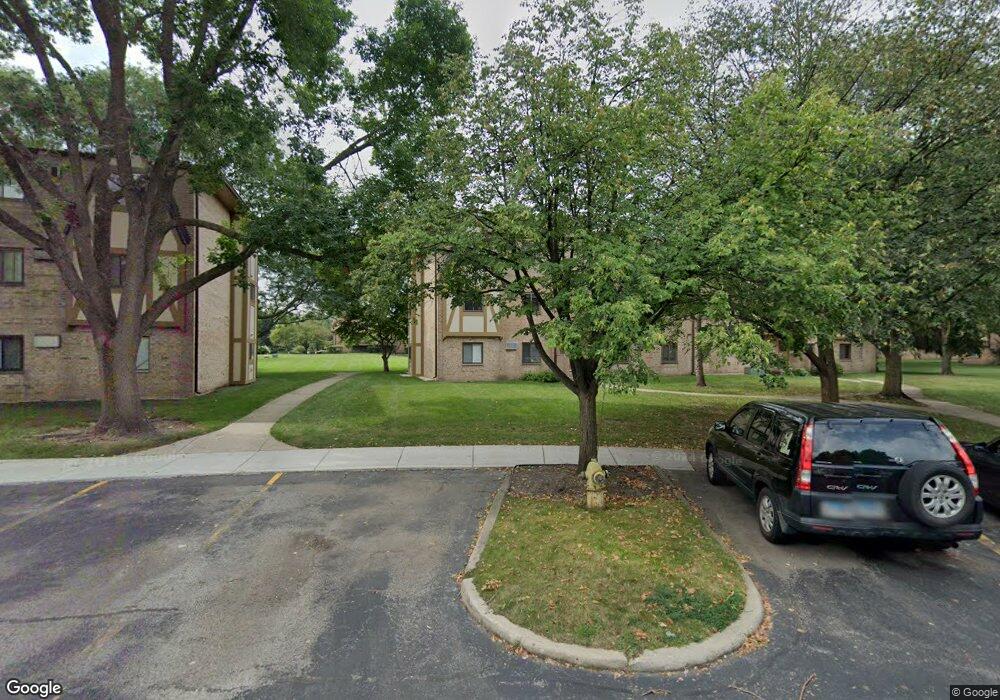
821 S Dwyer Ave Unit 821D Arlington Heights, IL 60005
Busse Woods NeighborhoodEstimated Value: $192,000 - $226,000
2
Beds
--
Bath
950
Sq Ft
$222/Sq Ft
Est. Value
About This Home
This home is located at 821 S Dwyer Ave Unit 821D, Arlington Heights, IL 60005 and is currently estimated at $211,302, approximately $222 per square foot. 821 S Dwyer Ave Unit 821D is a home located in Cook County with nearby schools including Westgate Elementary School, South Middle School, and Rolling Meadows High School.
Ownership History
Date
Name
Owned For
Owner Type
Purchase Details
Closed on
Dec 2, 2022
Sold by
Szott Henry A
Bought by
Yilmaz Orkun
Current Estimated Value
Home Financials for this Owner
Home Financials are based on the most recent Mortgage that was taken out on this home.
Original Mortgage
$128,350
Outstanding Balance
$125,801
Interest Rate
9.13%
Mortgage Type
New Conventional
Estimated Equity
$85,501
Purchase Details
Closed on
Nov 20, 2008
Sold by
Szott Leah T and Sill Leah T
Bought by
Szott Henry A
Home Financials for this Owner
Home Financials are based on the most recent Mortgage that was taken out on this home.
Original Mortgage
$124,000
Interest Rate
5.95%
Mortgage Type
Unknown
Purchase Details
Closed on
May 26, 2006
Sold by
Shea Diane Laney and Laney Diane
Bought by
Szott Leah T
Home Financials for this Owner
Home Financials are based on the most recent Mortgage that was taken out on this home.
Original Mortgage
$128,000
Interest Rate
6.68%
Mortgage Type
Fannie Mae Freddie Mac
Create a Home Valuation Report for This Property
The Home Valuation Report is an in-depth analysis detailing your home's value as well as a comparison with similar homes in the area
Home Values in the Area
Average Home Value in this Area
Purchase History
| Date | Buyer | Sale Price | Title Company |
|---|---|---|---|
| Yilmaz Orkun | $151,000 | None Listed On Document | |
| Yilmaz Orkun | $151,000 | -- | |
| Szott Henry A | $155,000 | Attorneys Title Guaranty Fun | |
| Szott Leah T | $160,000 | First American Title |
Source: Public Records
Mortgage History
| Date | Status | Borrower | Loan Amount |
|---|---|---|---|
| Open | Yilmaz Orkun | $128,350 | |
| Closed | Yilmaz Orkun | $128,350 | |
| Previous Owner | Szott Henry A | $124,000 | |
| Previous Owner | Szott Leah T | $128,000 |
Source: Public Records
Tax History Compared to Growth
Tax History
| Year | Tax Paid | Tax Assessment Tax Assessment Total Assessment is a certain percentage of the fair market value that is determined by local assessors to be the total taxable value of land and additions on the property. | Land | Improvement |
|---|---|---|---|---|
| 2024 | $3,230 | $11,800 | $2,377 | $9,423 |
| 2023 | $3,111 | $11,800 | $2,377 | $9,423 |
| 2022 | $3,111 | $11,800 | $2,377 | $9,423 |
| 2021 | $2,201 | $10,643 | $371 | $10,272 |
| 2020 | $2,211 | $10,643 | $371 | $10,272 |
| 2019 | $2,209 | $11,844 | $371 | $11,473 |
| 2018 | $1,255 | $7,735 | $297 | $7,438 |
| 2017 | $1,257 | $7,735 | $297 | $7,438 |
| 2016 | $1,409 | $7,735 | $297 | $7,438 |
| 2015 | $1,116 | $6,404 | $1,411 | $4,993 |
| 2014 | $1,099 | $6,404 | $1,411 | $4,993 |
| 2013 | $1,055 | $6,404 | $1,411 | $4,993 |
Source: Public Records
Map
Nearby Homes
- 1207 W Keating Dr
- 1602 W Orchard Place Unit 1602C
- 515 S Princeton Ave
- 1025 S Fernandez Ave Unit 4C
- 1025 S Fernandez Ave Unit 3M
- 1114 S Fernandez Ave
- 1106 S New Wilke Rd Unit 404
- 502 S Reuter Dr
- 1107 S Old Wilke Rd Unit 201
- 2100 Martin Ln
- 1127 S Old Wilke Rd Unit 403
- 3805 Wren Ln
- 1107 W White Oak St
- 316 S Reuter Dr
- 1206 S New Wilke Rd Unit 108
- 2201 Kingfisher Ln
- 1207 S Old Wilke Rd Unit 303
- 1217 S Old Wilke Rd Unit 11406
- 1306 S Walnut Ave
- 1227 S Old Wilke Rd Unit 12209
- 821 S Dwyer Ave Unit 2C
- 821 S Dwyer Ave Unit E
- 821 S Dwyer Ave Unit 821E
- 821 S Dwyer Ave Unit 821B
- 821 S Dwyer Ave Unit 821F
- 821 S Dwyer Ave Unit 821C
- 821 S Dwyer Ave Unit 821A
- 821 S Dwyer Ave Unit D
- 821 S Dwyer Ave Unit F
- 821 S Dwyer Ave Unit A
- 819 S Dwyer Ave Unit 819E
- 819 S Dwyer Ave Unit 819F
- 819 S Dwyer Ave Unit 819B
- 819 S Dwyer Ave Unit 819C
- 819 S Dwyer Ave Unit 819D
- 819 S Dwyer Ave Unit 819A
- 819 S Dwyer Ave Unit E
- 819 S Dwyer Ave
- 819 S Dwyer Ave Unit A
- 819 S Dwyer Ave Unit B