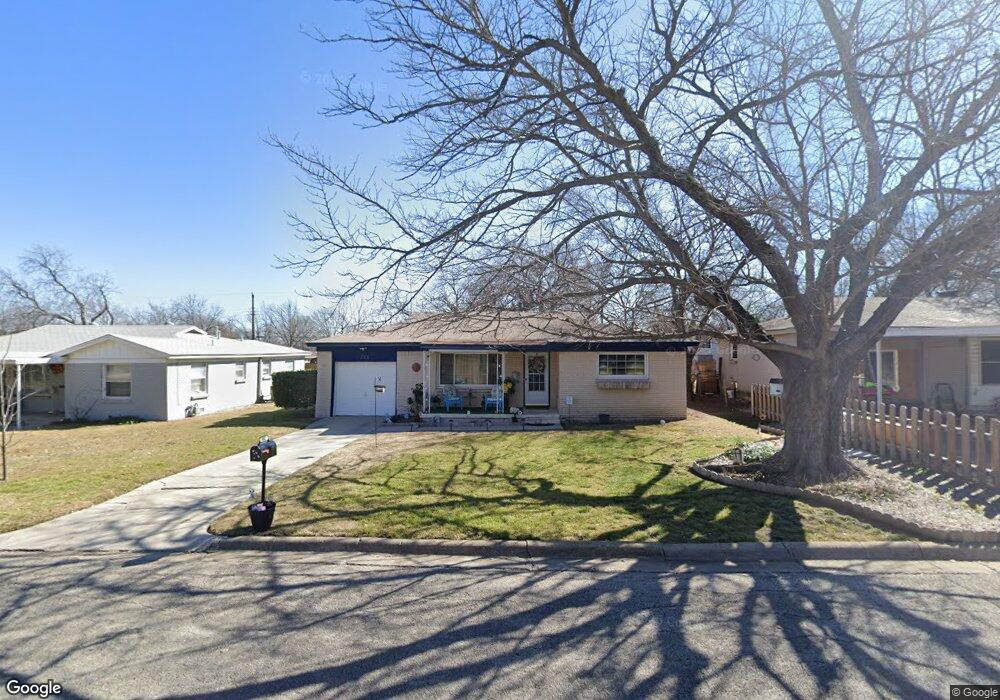
821 Sandell Dr Fort Worth, TX 76108
Estimated Value: $224,000 - $235,000
3
Beds
1
Bath
1,396
Sq Ft
$164/Sq Ft
Est. Value
About This Home
This home is located at 821 Sandell Dr, Fort Worth, TX 76108 and is currently estimated at $229,465, approximately $164 per square foot. 821 Sandell Dr is a home located in Tarrant County with nearby schools including Liberty Elementary School, Brewer Middle School, and Tannahill Intermediate School.
Ownership History
Date
Name
Owned For
Owner Type
Purchase Details
Closed on
Nov 11, 2003
Sold by
Davis Walter Lee and Davis Brenda N
Bought by
Spann William A
Current Estimated Value
Home Financials for this Owner
Home Financials are based on the most recent Mortgage that was taken out on this home.
Original Mortgage
$77,520
Outstanding Balance
$35,463
Interest Rate
5.81%
Mortgage Type
VA
Estimated Equity
$194,002
Create a Home Valuation Report for This Property
The Home Valuation Report is an in-depth analysis detailing your home's value as well as a comparison with similar homes in the area
Home Values in the Area
Average Home Value in this Area
Purchase History
| Date | Buyer | Sale Price | Title Company |
|---|---|---|---|
| Spann William A | -- | Hexter Fair Title Co |
Source: Public Records
Mortgage History
| Date | Status | Borrower | Loan Amount |
|---|---|---|---|
| Open | Spann William A | $77,520 |
Source: Public Records
Tax History Compared to Growth
Tax History
| Year | Tax Paid | Tax Assessment Tax Assessment Total Assessment is a certain percentage of the fair market value that is determined by local assessors to be the total taxable value of land and additions on the property. | Land | Improvement |
|---|---|---|---|---|
| 2025 | $2,377 | $212,830 | $44,040 | $168,790 |
| 2024 | $2,377 | $212,830 | $44,040 | $168,790 |
| 2023 | $3,593 | $224,287 | $44,040 | $180,247 |
| 2022 | $3,721 | $170,825 | $25,000 | $145,825 |
| 2021 | $3,436 | $155,428 | $25,000 | $130,428 |
| 2020 | $3,146 | $125,456 | $25,000 | $100,456 |
| 2019 | $2,969 | $122,526 | $25,000 | $97,526 |
| 2018 | $2,176 | $93,836 | $12,000 | $81,836 |
| 2017 | $2,493 | $89,014 | $12,000 | $77,014 |
| 2016 | $2,266 | $86,272 | $12,000 | $74,272 |
| 2015 | $1,696 | $70,500 | $10,000 | $60,500 |
| 2014 | $1,696 | $70,500 | $10,000 | $60,500 |
Source: Public Records
Map
Nearby Homes