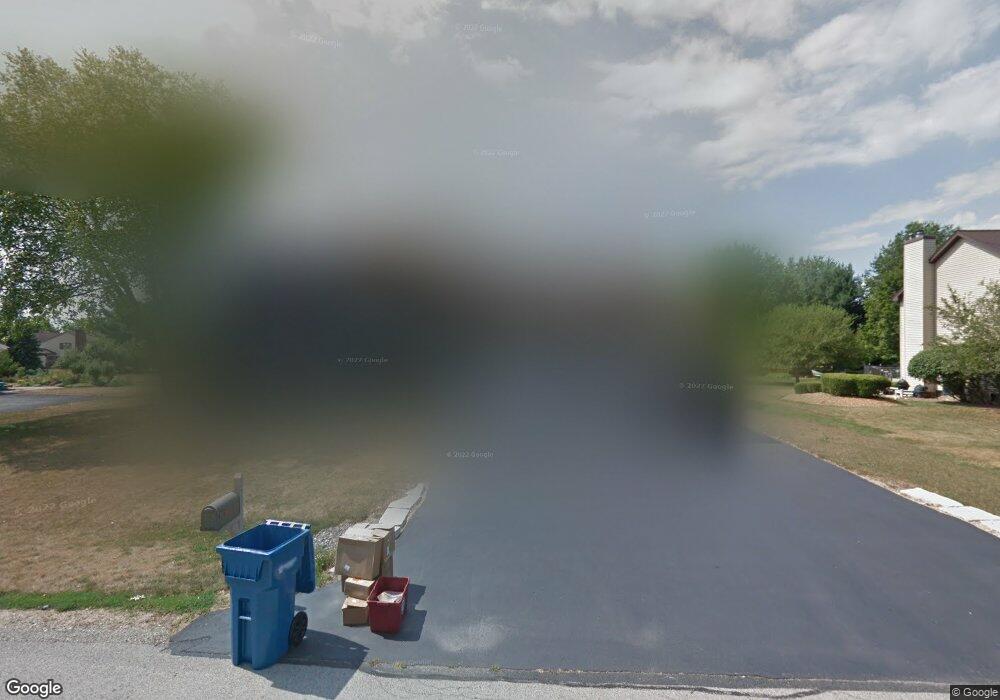
821 Surrey Ln Sleepy Hollow, IL 60118
Estimated Value: $443,369 - $520,000
4
Beds
--
Bath
2,360
Sq Ft
$208/Sq Ft
Est. Value
About This Home
This home is located at 821 Surrey Ln, Sleepy Hollow, IL 60118 and is currently estimated at $491,342, approximately $208 per square foot. 821 Surrey Ln is a home located in Kane County with nearby schools including Sleepy Hollow Elementary School, Dundee Middle School, and Dundee-Crown High School.
Ownership History
Date
Name
Owned For
Owner Type
Purchase Details
Closed on
Mar 23, 2007
Sold by
Sliwinski Richard M and Sliwinski Carola E
Bought by
Sliwinski Richard M and Sliwinski Carola E
Current Estimated Value
Create a Home Valuation Report for This Property
The Home Valuation Report is an in-depth analysis detailing your home's value as well as a comparison with similar homes in the area
Home Values in the Area
Average Home Value in this Area
Purchase History
| Date | Buyer | Sale Price | Title Company |
|---|---|---|---|
| Sliwinski Richard M | -- | None Available |
Source: Public Records
Tax History Compared to Growth
Tax History
| Year | Tax Paid | Tax Assessment Tax Assessment Total Assessment is a certain percentage of the fair market value that is determined by local assessors to be the total taxable value of land and additions on the property. | Land | Improvement |
|---|---|---|---|---|
| 2024 | $7,397 | $142,651 | $31,829 | $110,822 |
| 2023 | $7,909 | $128,353 | $28,639 | $99,714 |
| 2022 | $8,905 | $114,589 | $28,639 | $85,950 |
| 2021 | $8,631 | $108,195 | $27,041 | $81,154 |
| 2020 | $8,474 | $105,762 | $26,433 | $79,329 |
| 2019 | $8,239 | $100,401 | $25,093 | $75,308 |
| 2018 | $8,890 | $104,434 | $28,262 | $76,172 |
| 2017 | $8,539 | $97,693 | $26,438 | $71,255 |
| 2016 | $8,749 | $94,590 | $25,598 | $68,992 |
| 2015 | -- | $88,634 | $23,986 | $64,648 |
| 2014 | -- | $84,164 | $23,324 | $60,840 |
| 2013 | -- | $86,740 | $24,038 | $62,702 |
Source: Public Records
Map
Nearby Homes
- 1214 Carol Crest Dr
- 37 River Ridge Dr
- 900 Holly Ct
- 842 Winmoor Dr
- 937 Willow Ln
- 936 Glen Oak Dr
- 1042 Chateau Bluff Ln
- 849 Hemlock Dr
- 325 Sharon Dr
- 10 Chateau Dr
- 215 Sharon Dr
- 36W251 Oak Hill Dr
- 1715 W Main St
- 0000 Strom Dr
- 1022 Beau Brummel Dr
- 215 Hilltop Ln
- 1149 Gail Ln
- 496 Edinburgh Ln
- 503 Edinburgh Ln
- 214 S 7th St