821 SW 4th Ave Delray Beach, FL 33444
Downtown Delray Beach NeighborhoodEstimated payment $3,939/month
About This Lot
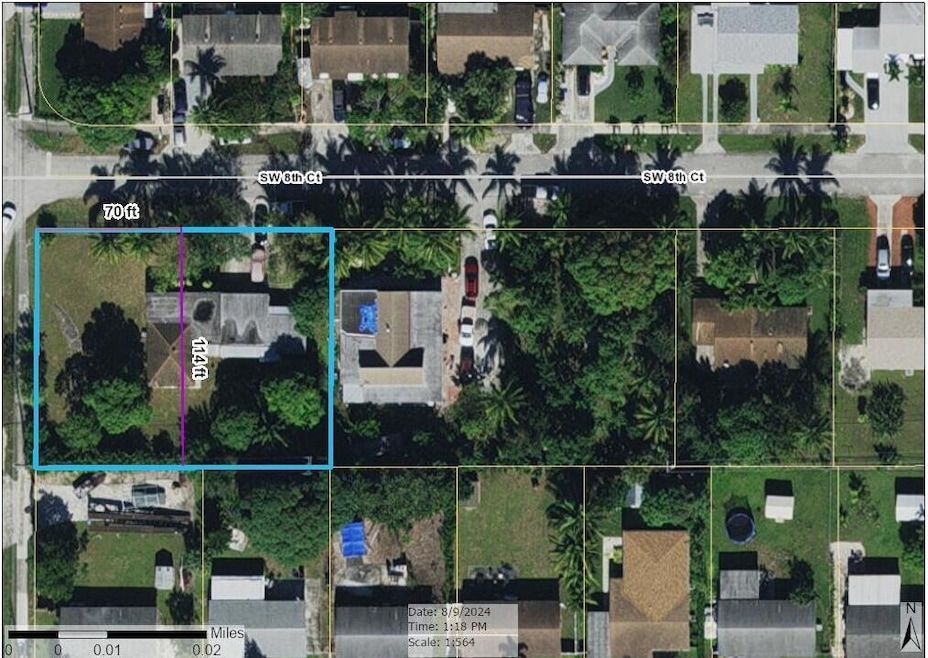
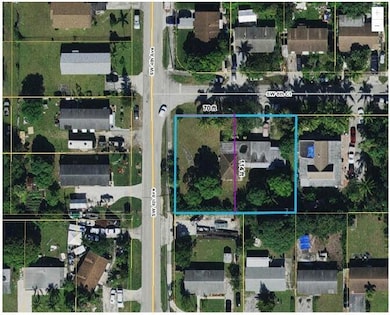
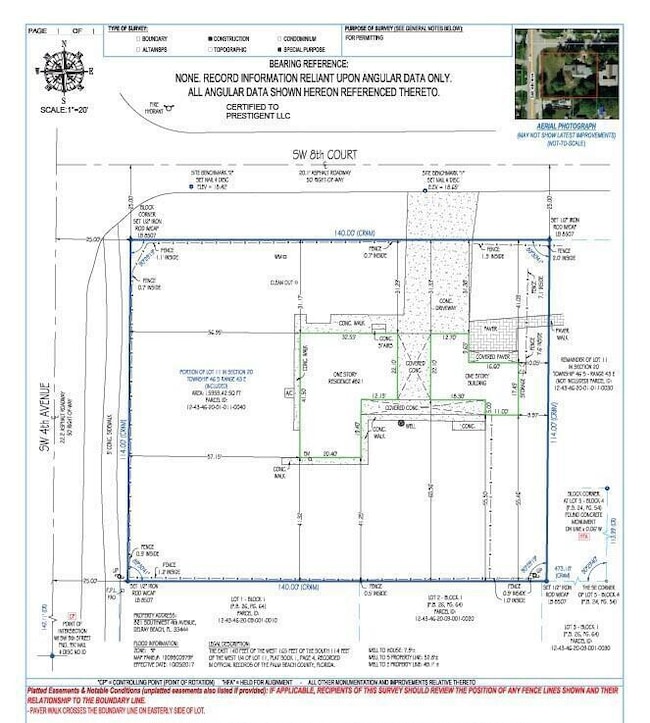
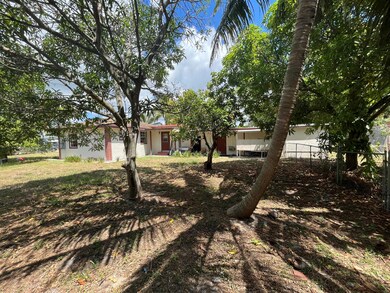
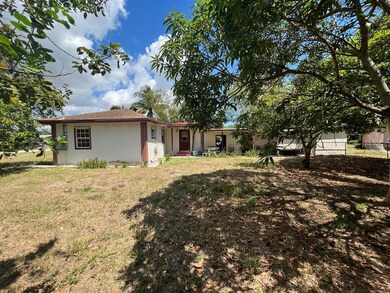
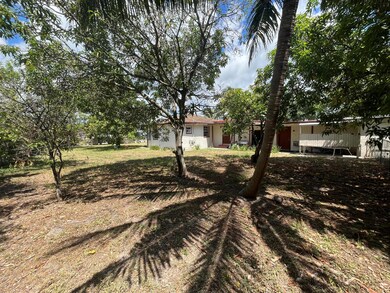
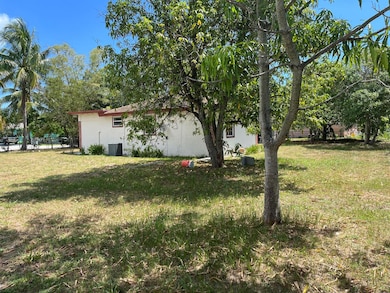
APPROVED SHORT-SALE! PROFORMA 10-11% CAP RATE! Downtown Delray builder special! 16,030sf CORNER LOT (140ftx114ft). Great opportunity! New construction around! Existing singe-family home situated on enormous lot and features main house with 3br/2ba, garage and two additional efficiency/studio units. Potential options: 1) Redevelopment opportunity: build 1 or 2 homes; each house could have large 8,000sf+/- lots 2) Add/build ADU, 3) Combine house into large interior space to create one large home 4) Rehab & maintain same floor plan then rent out all 3 spaces; PROFORMA 10-11% CAP RATE! Excellent location near Swinton Ave; ~1 mile to the beach. Spacious yard. Walk to Swinton/Atlantic Ave, downtown! No HOA! Short-term rental potential! Located in Opportunity Zone and Delray Beach CRA District!
Property Details
Property Type
- Land
Est. Annual Taxes
- $6,197
Lot Details
- 0.37 Acre Lot
- Lot Dimensions are 140' x 114'
- Beach Front
- Site Plan Filed
Location
- City Lot
Community Details
- Town Of Delray Beach / Do Subdivision
Listing and Financial Details
- Assessor Parcel Number 12434620010110040
Map
Home Values in the Area
Average Home Value in this Area
Tax History
| Year | Tax Paid | Tax Assessment Tax Assessment Total Assessment is a certain percentage of the fair market value that is determined by local assessors to be the total taxable value of land and additions on the property. | Land | Improvement |
|---|---|---|---|---|
| 2024 | $6,519 | $281,096 | -- | -- |
| 2023 | $6,197 | $255,542 | $222,762 | $202,093 |
| 2022 | $5,294 | $232,311 | $0 | $0 |
| 2021 | $4,501 | $211,192 | $84,000 | $127,192 |
| 2020 | $3,708 | $197,235 | $75,000 | $122,235 |
| 2019 | $3,522 | $191,875 | $65,400 | $126,475 |
| 2018 | $3,144 | $175,024 | $56,001 | $119,023 |
| 2017 | $2,853 | $147,309 | $46,667 | $100,642 |
| 2016 | $2,583 | $106,931 | $0 | $0 |
| 2015 | $2,408 | $97,210 | $0 | $0 |
| 2014 | $2,201 | $88,373 | $0 | $0 |
Property History
| Date | Event | Price | List to Sale | Price per Sq Ft | Prior Sale |
|---|---|---|---|---|---|
| 11/17/2025 11/17/25 | Price Changed | $650,000 | +26.2% | $404 / Sq Ft | |
| 06/26/2025 06/26/25 | Price Changed | $515,000 | -20.8% | $320 / Sq Ft | |
| 08/09/2024 08/09/24 | For Sale | $650,000 | +282.4% | $404 / Sq Ft | |
| 09/21/2020 09/21/20 | Sold | $170,000 | -38.2% | $157 / Sq Ft | View Prior Sale |
| 08/22/2020 08/22/20 | Pending | -- | -- | -- | |
| 04/10/2020 04/10/20 | For Sale | $275,000 | -- | $254 / Sq Ft |
Purchase History
| Date | Type | Sale Price | Title Company |
|---|---|---|---|
| Personal Reps Deed | $170,000 | Attorney | |
| Warranty Deed | $67,500 | -- |
Mortgage History
| Date | Status | Loan Amount | Loan Type |
|---|---|---|---|
| Previous Owner | $56,900 | New Conventional |
Source: BeachesMLS
MLS Number: R11011239
APN: 12-43-46-20-01-011-0040
Disclaimer: Certain information contained herein is derived from information provided by parties other than Homes.com. All information provided is deemed reliable, but is not guaranteed to be accurate and should be independently verified.
![]() IDX information is provided exclusively for personal, non-commercial use, and may not be used for any purpose other than to identify prospective properties consumers may be interested in purchasing. Information is deemed reliable but not guaranteed.
IDX information is provided exclusively for personal, non-commercial use, and may not be used for any purpose other than to identify prospective properties consumers may be interested in purchasing. Information is deemed reliable but not guaranteed.
- 221 NE 10th St
- 517 SW 10th St
- 134 SW 10th Ave
- 810 S Swinton Ave
- 619 SW 10th St
- 902 S Swinton Ave
- 702 SW 7th St
- 701 SW 8th Ave
- 1015 Ventnor Ave Unit 3D
- 1000 Old Dixie Hwy
- 191 Sterling Ave
- 408 SW 4th St
- 522 Lucky Ln
- 301 Southridge Rd
- 348 SW 4th Ave
- 16648 SW 8th Ave
- 608 SE 2nd Ave
- 341 SW Oak Alley
- 417 SW 8th Ave
- 107 Central Ave
- 413 SW 10th St
- 608 SW 8th Ct
- 601 SW 10th St
- 1019 W Longport Cir Unit 5B
- 623 SW 10th St
- 1100 SW 4th Ave Unit 12C
- 422 SW 4th Ave Unit B
- 608 SE 2nd Ave
- 830 SE 3rd Ave
- 2417 Sundy Ave
- 325 SW 4th Ave
- 240 SE 10th St
- 300 SE 7th Ave
- 332 S Swinton Ave
- 318 SE 7th Ave Unit 3
- 314 SW 4th Ave
- 337 SW 8th Ave
- 706 SE 4th Ave
- 2259 Linton Ridge Cir Unit G4
- 335 SE 6th Ave Unit 402
