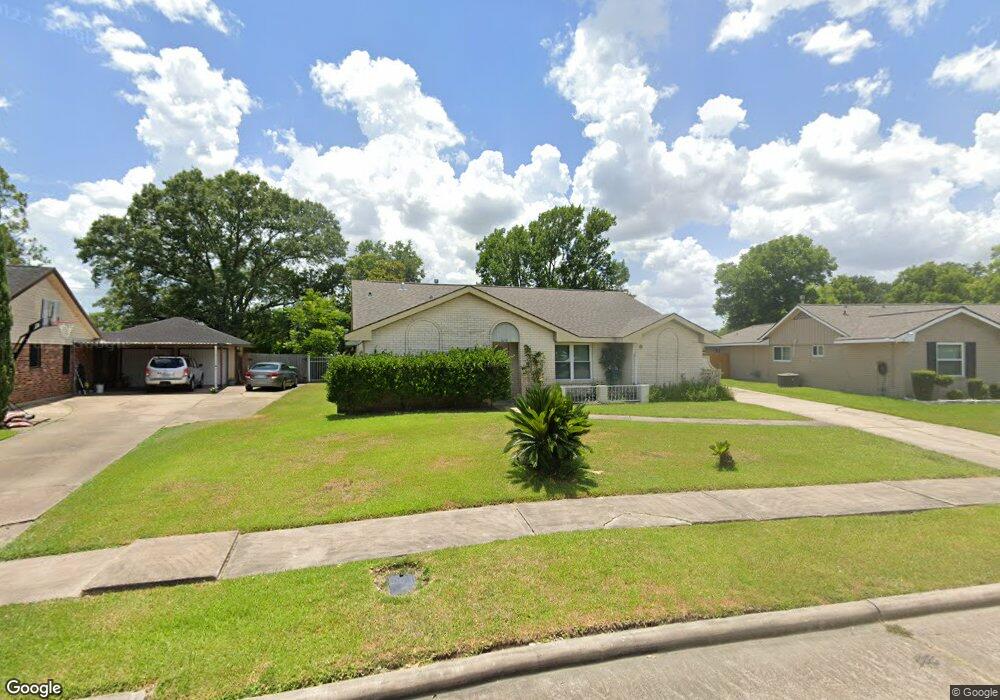
8210 Lettie St Houston, TX 77075
Greater Hobby Area NeighborhoodEstimated Value: $251,000 - $325,000
3
Beds
3
Baths
1,944
Sq Ft
$154/Sq Ft
Est. Value
About This Home
This home is located at 8210 Lettie St, Houston, TX 77075 and is currently estimated at $298,443, approximately $153 per square foot. 8210 Lettie St is a home located in Harris County with nearby schools including Mitchell Elementary School, Albert Thomas Middle School, and Ross Shaw Sterling Aviation High School.
Ownership History
Date
Name
Owned For
Owner Type
Purchase Details
Closed on
Jul 24, 2012
Sold by
Green Tree Servicing Llc
Bought by
Castillo Saturnino
Current Estimated Value
Purchase Details
Closed on
Oct 29, 2009
Sold by
Mitchell Osby B and Mitchell Sharon E
Bought by
Martinez Delfino
Home Financials for this Owner
Home Financials are based on the most recent Mortgage that was taken out on this home.
Original Mortgage
$108,007
Interest Rate
5.05%
Mortgage Type
FHA
Purchase Details
Closed on
Oct 24, 1996
Sold by
Habermacher Stephen R and Habermacher Rosemary P
Bought by
Mitchell Osby B and Mitchell Sharon E
Home Financials for this Owner
Home Financials are based on the most recent Mortgage that was taken out on this home.
Original Mortgage
$60,800
Interest Rate
8.15%
Create a Home Valuation Report for This Property
The Home Valuation Report is an in-depth analysis detailing your home's value as well as a comparison with similar homes in the area
Home Values in the Area
Average Home Value in this Area
Purchase History
| Date | Buyer | Sale Price | Title Company |
|---|---|---|---|
| Castillo Saturnino | -- | None Available | |
| Martinez Delfino | -- | Startex Title Company | |
| Mitchell Osby B | -- | Texas American Title Company |
Source: Public Records
Mortgage History
| Date | Status | Borrower | Loan Amount |
|---|---|---|---|
| Previous Owner | Martinez Delfino | $108,007 | |
| Previous Owner | Mitchell Osby B | $60,800 | |
| Closed | Castillo Saturnino | $0 |
Source: Public Records
Tax History Compared to Growth
Tax History
| Year | Tax Paid | Tax Assessment Tax Assessment Total Assessment is a certain percentage of the fair market value that is determined by local assessors to be the total taxable value of land and additions on the property. | Land | Improvement |
|---|---|---|---|---|
| 2025 | $3,278 | $363,875 | $56,940 | $306,935 |
| 2024 | $3,278 | $321,244 | $55,232 | $266,012 |
| 2023 | $3,278 | $350,043 | $55,232 | $294,811 |
| 2022 | $4,826 | $303,537 | $55,232 | $248,305 |
| 2021 | $4,343 | $257,061 | $39,766 | $217,295 |
| 2020 | $4,102 | $241,066 | $38,947 | $202,119 |
| 2019 | $3,897 | $204,026 | $38,127 | $165,899 |
| 2018 | $1,157 | $71,691 | $40,997 | $30,694 |
| 2017 | $3,428 | $141,810 | $40,997 | $100,813 |
| 2016 | $3,116 | $123,246 | $40,997 | $82,249 |
| 2015 | $2,084 | $119,309 | $40,997 | $78,312 |
| 2014 | $2,084 | $111,895 | $25,623 | $86,272 |
Source: Public Records
Map
Nearby Homes
- 8006 Hall Rd
- 8615 Tartan Walk Ln
- 8420 Fuqua St
- 10806 Tallow Briar
- 8718 Black Cliff Ln
- 0 Leitz Rd
- 10815 Leitz Rd
- 7851 Fuqua St
- TBD Arrowhead Ln
- 8612 Fuqua St
- 11115 Opal Glen Ln
- 001 Fuqua St
- 1006 Union Valley Dr
- 3406 Robinson Dr
- 8405 Folkstone Ln
- 10809 Telephone Rd
- 8417 Folkstone Ln
- 8412 Peekskill Ln
- 1106 Glenda St
- 10405 Gulf Meadows Dr
- 8206 Lettie St
- 8214 Lettie St
- 8222 Coastway Ln
- 8218 Lettie St
- 8218 Coastway Ln
- 8215 Lettie St
- 8230 Coastway Ln
- 8219 Lettie St
- 8214 Coastway Ln
- 8222 Lettie St
- 8234 Coastway Ln
- 8223 Lettie St
- 8210 Coastway Ln
- 8226 Lettie St
- 8223 Coastway Ln
- 8238 Coastway Ln
- 8219 Coastway Ln
- 8227 Coastway Ln
- 8215 Coastway Ln
- 8303 Lettie St