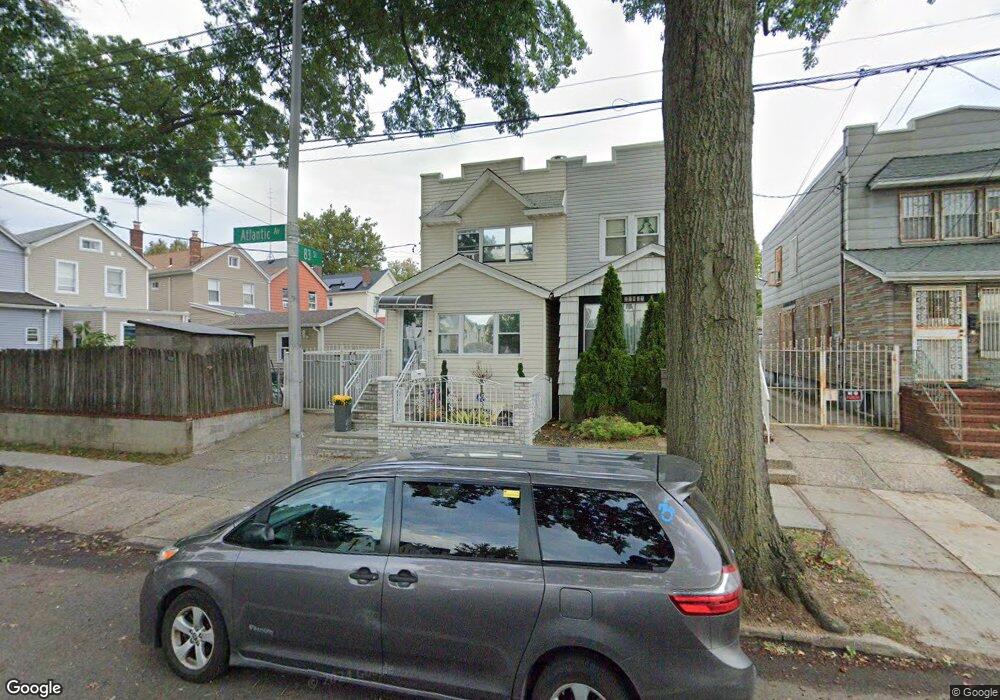
8211 Atlantic Ave Woodhaven, NY 11421
Woodhaven NeighborhoodEstimated Value: $622,000 - $684,000
--
Bed
--
Bath
1,114
Sq Ft
$588/Sq Ft
Est. Value
About This Home
This home is located at 8211 Atlantic Ave, Woodhaven, NY 11421 and is currently estimated at $654,478, approximately $587 per square foot. 8211 Atlantic Ave is a home located in Queens County with nearby schools including P.S. 060 Woodhaven, Jhs 210 Elizabeth Blackwell, and St. Thomas the Apostle Catholic Academy.
Ownership History
Date
Name
Owned For
Owner Type
Purchase Details
Closed on
May 8, 2015
Sold by
Miller Yolanda and Rodriguez Yolanda
Bought by
Muniz Cynthia and Rivera Christopher
Current Estimated Value
Home Financials for this Owner
Home Financials are based on the most recent Mortgage that was taken out on this home.
Original Mortgage
$348,570
Outstanding Balance
$268,623
Interest Rate
3.69%
Mortgage Type
New Conventional
Estimated Equity
$385,855
Purchase Details
Closed on
May 2, 2007
Sold by
Naranjo Carlos A and Rodriguez Yolanda
Bought by
Miller Yolanda and Rodriguez Yolanda
Create a Home Valuation Report for This Property
The Home Valuation Report is an in-depth analysis detailing your home's value as well as a comparison with similar homes in the area
Home Values in the Area
Average Home Value in this Area
Purchase History
| Date | Buyer | Sale Price | Title Company |
|---|---|---|---|
| Muniz Cynthia | $355,000 | -- | |
| Miller Yolanda | -- | -- |
Source: Public Records
Mortgage History
| Date | Status | Borrower | Loan Amount |
|---|---|---|---|
| Open | Muniz Cynthia | $348,570 |
Source: Public Records
Tax History Compared to Growth
Tax History
| Year | Tax Paid | Tax Assessment Tax Assessment Total Assessment is a certain percentage of the fair market value that is determined by local assessors to be the total taxable value of land and additions on the property. | Land | Improvement |
|---|---|---|---|---|
| 2025 | $5,181 | $27,337 | $7,913 | $19,424 |
| 2024 | $5,181 | $25,795 | $8,945 | $16,850 |
| 2023 | $5,181 | $25,795 | $7,657 | $18,138 |
| 2022 | $4,892 | $36,060 | $11,880 | $24,180 |
| 2021 | $5,081 | $29,880 | $11,880 | $18,000 |
| 2020 | $4,822 | $29,340 | $11,880 | $17,460 |
| 2019 | $4,497 | $29,700 | $11,880 | $17,820 |
| 2018 | $4,382 | $21,496 | $7,838 | $13,658 |
| 2017 | $4,163 | $20,420 | $10,210 | $10,210 |
| 2016 | $4,022 | $20,420 | $10,210 | $10,210 |
| 2015 | $2,104 | $18,984 | $10,764 | $8,220 |
| 2014 | $2,104 | $17,914 | $12,201 | $5,713 |
Source: Public Records
Map
Nearby Homes