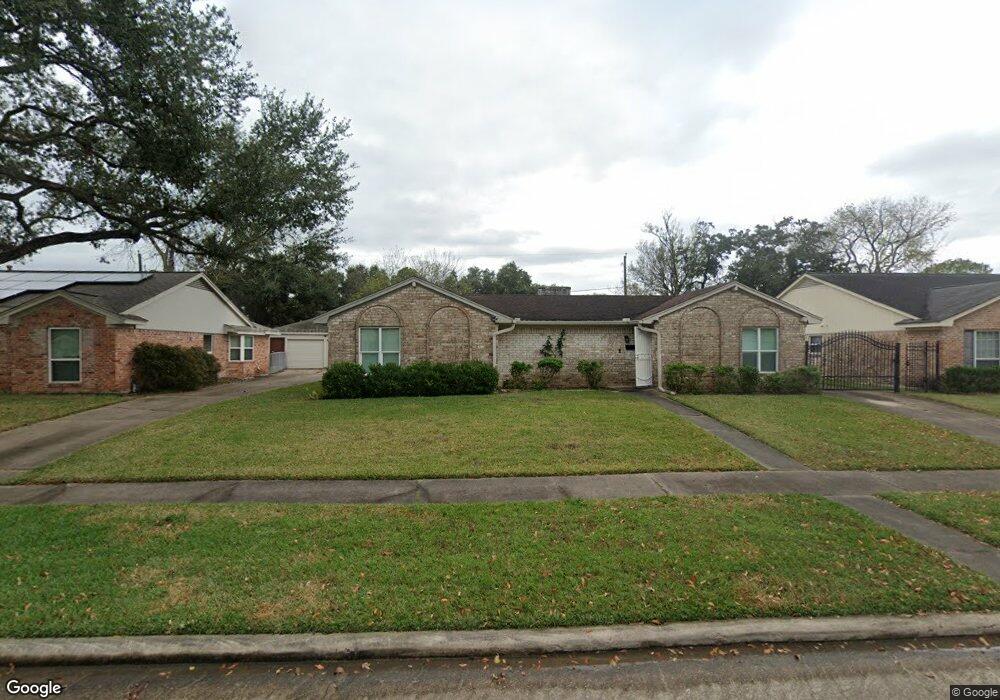
8211 Sharpcrest St Houston, TX 77036
Sharpstown NeighborhoodEstimated Value: $319,000 - $345,000
3
Beds
2
Baths
1,905
Sq Ft
$171/Sq Ft
Est. Value
About This Home
This home is located at 8211 Sharpcrest St, Houston, TX 77036 and is currently estimated at $326,476, approximately $171 per square foot. 8211 Sharpcrest St is a home located in Harris County with nearby schools including Neff Elementary School, Sugar Grove Academy, and Sharpstown High School.
Ownership History
Date
Name
Owned For
Owner Type
Purchase Details
Closed on
Aug 15, 2018
Sold by
Liu Yu and Deng Boyun
Bought by
Chen John
Current Estimated Value
Home Financials for this Owner
Home Financials are based on the most recent Mortgage that was taken out on this home.
Original Mortgage
$172,000
Outstanding Balance
$149,375
Interest Rate
4.5%
Mortgage Type
New Conventional
Estimated Equity
$177,101
Purchase Details
Closed on
Jul 14, 2017
Sold by
Liu Whitman T and Wan Grace M
Bought by
Liu Yu and Deng Boyun
Purchase Details
Closed on
Aug 12, 2016
Sold by
Easy Street Company Llc
Bought by
Lui Whitman T
Purchase Details
Closed on
Mar 14, 2016
Sold by
Richardson Christine Ann
Bought by
Easy Stree Company Llc
Home Financials for this Owner
Home Financials are based on the most recent Mortgage that was taken out on this home.
Original Mortgage
$145,000
Interest Rate
3.72%
Mortgage Type
New Conventional
Create a Home Valuation Report for This Property
The Home Valuation Report is an in-depth analysis detailing your home's value as well as a comparison with similar homes in the area
Home Values in the Area
Average Home Value in this Area
Purchase History
| Date | Buyer | Sale Price | Title Company |
|---|---|---|---|
| Chen John | -- | Fidelity National Title | |
| Liu Yu | -- | None Available | |
| Lui Whitman T | -- | None Available | |
| Easy Stree Company Llc | -- | None Available |
Source: Public Records
Mortgage History
| Date | Status | Borrower | Loan Amount |
|---|---|---|---|
| Open | Chen John | $172,000 | |
| Previous Owner | Easy Stree Company Llc | $145,000 |
Source: Public Records
Tax History Compared to Growth
Tax History
| Year | Tax Paid | Tax Assessment Tax Assessment Total Assessment is a certain percentage of the fair market value that is determined by local assessors to be the total taxable value of land and additions on the property. | Land | Improvement |
|---|---|---|---|---|
| 2025 | $7,118 | $301,690 | $135,821 | $165,869 |
| 2024 | $7,118 | $340,191 | $98,093 | $242,098 |
| 2023 | $7,118 | $343,973 | $98,093 | $245,880 |
| 2022 | $6,688 | $293,101 | $60,365 | $232,736 |
| 2021 | $5,991 | $257,051 | $60,365 | $196,686 |
| 2020 | $5,494 | $219,628 | $60,365 | $159,263 |
| 2019 | $5,612 | $215,000 | $45,274 | $169,726 |
| 2018 | $4,504 | $236,227 | $45,274 | $190,953 |
| 2017 | $5,918 | $226,868 | $45,274 | $181,594 |
| 2016 | $4,742 | $181,800 | $45,274 | $136,526 |
| 2015 | $3,674 | $163,310 | $45,274 | $118,036 |
| 2014 | $3,674 | $142,932 | $45,274 | $97,658 |
Source: Public Records
Map
Nearby Homes
- 8119 Concho St
- 8218 Hazen St
- 8019 Sharpview Dr
- 8403 Concho St
- 8419 Stroud Dr
- 8418 Hazen St
- 7302 Burning Tree Dr
- 7302 Redding Rd
- 8530 Roos Rd
- 7230 Redding Rd
- 8314 Edgemoor Dr
- 7303 Augustine Dr
- 8223 Bellaire Blvd
- 8527 Edgemoor Dr
- 7622 Troulon Dr
- 8818 Roos Rd
- 8902 Langdon Ln
- 7819 Bellaire Blvd
- 8918 Langdon Ln
- 8923 Hendon Ln
- 8207 Sharpcrest St
- 8215 Sharpcrest St
- 8210 Langdon Ln
- 8206 Langdon Ln
- 8214 Langdon Ln
- 8203 Sharpcrest St
- 8219 Sharpcrest St
- 8210 Sharpcrest St
- 8202 Langdon Ln
- 8218 Langdon Ln
- 8206 Sharpcrest St
- 8214 Sharpcrest St
- 8123 Sharpcrest St
- 8202 Sharpcrest St
- 8218 Sharpcrest St
- 8122 Langdon Ln
- 8126 Sharpcrest St
- 8119 Sharpcrest St
- 8303 Sharpcrest St
- 8211 Langdon Ln