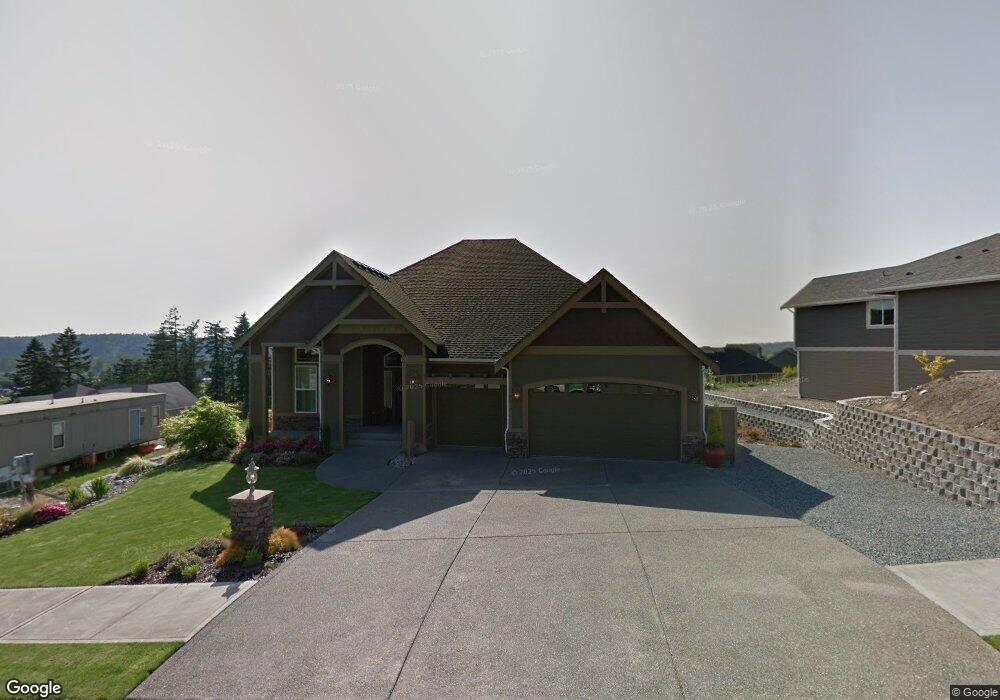
8214 173rd Ave E Sumner, WA 98390
Estimated Value: $866,000 - $1,098,000
4
Beds
3
Baths
3,704
Sq Ft
$264/Sq Ft
Est. Value
About This Home
This home is located at 8214 173rd Ave E, Sumner, WA 98390 and is currently estimated at $978,216, approximately $264 per square foot. 8214 173rd Ave E is a home located in Pierce County with nearby schools including Maple Lawn Elementary School, Sumner Middle School, and Sumner High School.
Ownership History
Date
Name
Owned For
Owner Type
Purchase Details
Closed on
Sep 27, 2023
Sold by
Anderson Randolph A and Anderson Paula K
Bought by
Anderson Family Living Trust and Anderson
Current Estimated Value
Purchase Details
Closed on
Feb 25, 2009
Sold by
Citybank
Bought by
Anderson Randy and Anderson Paula
Home Financials for this Owner
Home Financials are based on the most recent Mortgage that was taken out on this home.
Original Mortgage
$408,000
Interest Rate
4.91%
Mortgage Type
Seller Take Back
Purchase Details
Closed on
Dec 16, 2008
Sold by
Beard Construction Llc
Bought by
City Bank
Purchase Details
Closed on
May 7, 2007
Sold by
Benum Enterprises Inc
Bought by
Beard Construction Llc
Create a Home Valuation Report for This Property
The Home Valuation Report is an in-depth analysis detailing your home's value as well as a comparison with similar homes in the area
Home Values in the Area
Average Home Value in this Area
Purchase History
| Date | Buyer | Sale Price | Title Company |
|---|---|---|---|
| Anderson Family Living Trust | -- | None Listed On Document | |
| Anderson Randy | $530,000 | Ticor | |
| City Bank | -- | Talon Group | |
| Beard Construction Llc | -- | Talon Group | |
| Beard Construction Llc | $1,761,768 | Talon Group | |
| Benum Enterprises Inc | $3,521,429 | Talon Group | |
| Benum Enterprises Inc | $5,283,197 | Talon Group |
Source: Public Records
Mortgage History
| Date | Status | Borrower | Loan Amount |
|---|---|---|---|
| Previous Owner | Anderson Randy | $408,000 |
Source: Public Records
Tax History
| Year | Tax Paid | Tax Assessment Tax Assessment Total Assessment is a certain percentage of the fair market value that is determined by local assessors to be the total taxable value of land and additions on the property. | Land | Improvement |
|---|---|---|---|---|
| 2025 | $8,608 | $976,200 | $332,100 | $644,100 |
| 2024 | $8,608 | $908,800 | $299,900 | $608,900 |
| 2023 | $8,608 | $811,500 | $270,500 | $541,000 |
| 2022 | $9,083 | $793,300 | $245,800 | $547,500 |
| 2021 | $8,899 | $654,400 | $182,200 | $472,200 |
| 2019 | $7,662 | $620,000 | $162,400 | $457,600 |
| 2018 | $8,111 | $591,400 | $156,000 | $435,400 |
| 2017 | $7,142 | $551,900 | $135,900 | $416,000 |
| 2016 | $6,277 | $457,300 | $117,000 | $340,300 |
| 2014 | $6,570 | $419,400 | $101,100 | $318,300 |
| 2013 | $6,570 | $403,100 | $88,600 | $314,500 |
Source: Public Records
Map
Nearby Homes
- 17233 Washington 410
- 7814 176th Avenue Ct E
- 7814 176th Avenue Ct E Unit A
- 18103 81st St E
- 8301 183rd Ave E
- 8007 183rd Ave E
- 7723 183rd Ave E
- 8307 184th Ave E
- 7734 183rd Ave E
- 8505 185th Avenue Place E
- 16221 75th St E
- 9504 179th Avenue Place E
- 7009 181st Ave E
- 15713 81st St E Unit 135
- 15708 81st St E Unit 131
- 18113 96th Street Ct E
- 7521 188th Ave E
- 7212 188th Ave E
- 9615 183rd Ave E
- 10010 181st Avenue Ct E
- 8206 173rd Ave E
- 8218 173rd Ave E
- 8209 172nd Ave E
- 8213 172nd Ave E
- 8120 173rd Ave E
- 8209 173rd Ave E
- 8215 173rd Ave E
- 8211 173rd Ave E
- 8207 173rd Ave E
- 8116 173rd Ave E
- 8303 172nd Avenue Ct E
- 8203 173rd Ave E
- 8302 172nd Avenue Ct E
- 8201 172nd Ave E
- 8121 173rd Ave E
- 8307 172nd Avenue Ct E
- 8112 173rd Ave E
- 8212 172nd Ave E
- 17304 82nd Street Ct E
Your Personal Tour Guide
Ask me questions while you tour the home.