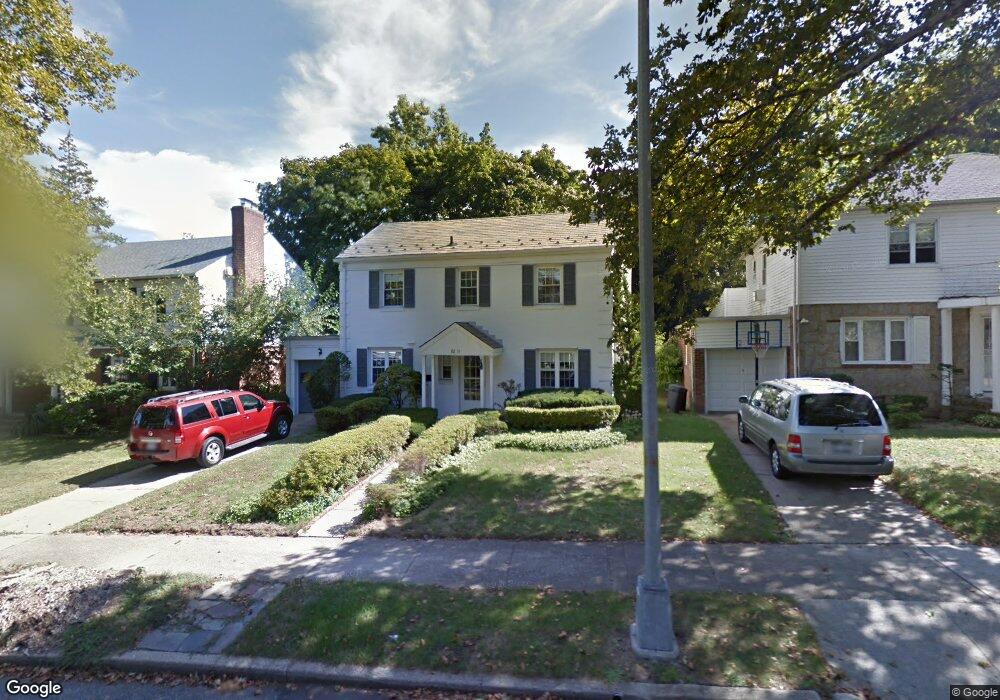
8215 190th St Hollis, NY 11423
Jamaica Estates NeighborhoodEstimated Value: $1,255,000 - $1,552,000
--
Bed
--
Bath
1,544
Sq Ft
$893/Sq Ft
Est. Value
About This Home
This home is located at 8215 190th St, Hollis, NY 11423 and is currently estimated at $1,378,684, approximately $892 per square foot. 8215 190th St is a home located in Queens County with nearby schools including P.S. I.S. 178 The Holliswood School, George J. Ryan Middle School 216, and Holy Family School.
Ownership History
Date
Name
Owned For
Owner Type
Purchase Details
Closed on
Dec 28, 2012
Sold by
Deborah Carol Scherer Trust and Estate Of Beulah Scherer
Bought by
Trail Robert L and Udagawa Aya
Current Estimated Value
Home Financials for this Owner
Home Financials are based on the most recent Mortgage that was taken out on this home.
Original Mortgage
$625,000
Outstanding Balance
$431,273
Interest Rate
3.36%
Mortgage Type
New Conventional
Estimated Equity
$947,411
Purchase Details
Closed on
Sep 28, 2011
Sold by
Scherer Beulah
Bought by
Deborah Carol Scherer Trust
Purchase Details
Closed on
Apr 14, 2010
Sold by
Deborah Carol Scherer Trust and Scherer
Bought by
Scherer Beulah and Scherer
Purchase Details
Closed on
Apr 14, 1999
Sold by
Scherer Beulah and Scherer Bernard I
Bought by
Scherer Beulah and Scherer Martin William
Create a Home Valuation Report for This Property
The Home Valuation Report is an in-depth analysis detailing your home's value as well as a comparison with similar homes in the area
Home Values in the Area
Average Home Value in this Area
Purchase History
| Date | Buyer | Sale Price | Title Company |
|---|---|---|---|
| Trail Robert L | $827,500 | -- | |
| Trail Robert L | $827,500 | -- | |
| Deborah Carol Scherer Trust | -- | -- | |
| Deborah Carol Scherer Trust | -- | -- | |
| Scherer Beulah | $210,000 | -- | |
| Scherer Beulah | $210,000 | -- | |
| Deborah Carol Scherer Trust | -- | -- | |
| Scherer Beulah | -- | -- | |
| Scherer Beulah | -- | -- |
Source: Public Records
Mortgage History
| Date | Status | Borrower | Loan Amount |
|---|---|---|---|
| Open | Trail Robert L | $625,000 | |
| Closed | Trail Robert L | $625,000 |
Source: Public Records
Tax History Compared to Growth
Tax History
| Year | Tax Paid | Tax Assessment Tax Assessment Total Assessment is a certain percentage of the fair market value that is determined by local assessors to be the total taxable value of land and additions on the property. | Land | Improvement |
|---|---|---|---|---|
| 2025 | $11,473 | $62,033 | $18,595 | $43,438 |
| 2024 | $11,485 | $58,522 | $20,913 | $37,609 |
| 2023 | $10,808 | $55,210 | $16,752 | $38,458 |
| 2022 | $10,402 | $66,600 | $22,320 | $44,280 |
| 2021 | $10,973 | $55,200 | $22,320 | $32,880 |
| 2020 | $10,646 | $53,820 | $22,320 | $31,500 |
| 2019 | $9,909 | $59,280 | $22,320 | $36,960 |
| 2018 | $9,081 | $46,008 | $14,818 | $31,190 |
| 2017 | $8,796 | $44,622 | $16,290 | $28,332 |
| 2016 | $8,611 | $44,622 | $16,290 | $28,332 |
| 2015 | $4,857 | $43,078 | $19,680 | $23,398 |
| 2014 | $4,857 | $40,640 | $22,290 | $18,350 |
Source: Public Records
Map
Nearby Homes
- 81-48 192nd St
- 18631 Radnor Rd
- 186-31 Radnor Rd
- 80-48 190th St
- 80-50 189th St
- 80-47 188th St
- 193-03 85th Rd
- 81-22 Haddon St
- 186-35 80th Dr
- 80-11 190th St
- 186-15 Grand Central Pkwy
- 184-46 Aberdeen Rd
- 80-03 192nd St
- 8012 188th St
- 18547 80th Rd
- 195-12 Mclaughlin Ave
- 19346 Mclaughlin Ave
- 8515 Kent St
- 19512 Mclaughlin Ave
- 195-22 Mclaughlin Ave
- 82-15 190th St
- 82-23 190th St
- 8209 190th St
- 8219 190th St
- 19006 Aberdeen Rd
- 8223 190th St
- 8223 190th St
- 8214 192nd St
- 8206 192nd St
- 8218 192nd St
- 19016 Aberdeen Rd
- 8214 190th St
- 8227 190th St
- 8224 192nd St
- 18910 Aberdeen Rd
- 8226 190th St
- 82-26 190th St Unit WH
- 8153 190th St
- 81-53 190th St
- 8233 190th St