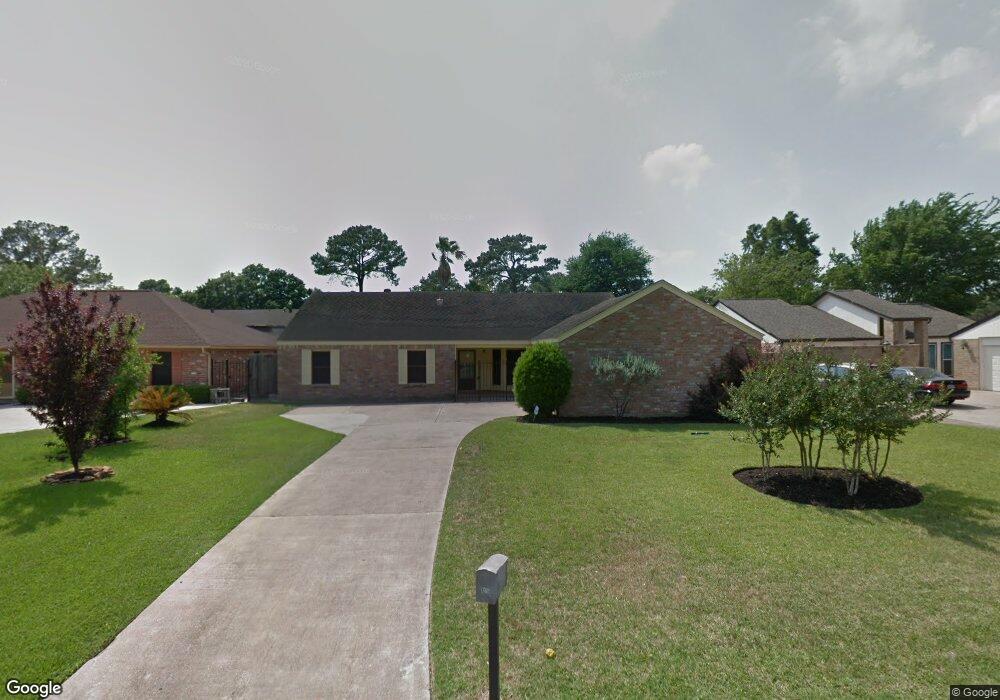
8215 Debbie Gay Dr Houston, TX 77040
Brookhollow West NeighborhoodEstimated Value: $284,103 - $342,000
3
Beds
2
Baths
1,956
Sq Ft
$160/Sq Ft
Est. Value
About This Home
This home is located at 8215 Debbie Gay Dr, Houston, TX 77040 and is currently estimated at $312,776, approximately $159 per square foot. 8215 Debbie Gay Dr is a home located in Harris County with nearby schools including Reed Elementary School, Dean Middle School, and Jersey Village High School.
Ownership History
Date
Name
Owned For
Owner Type
Purchase Details
Closed on
Jan 26, 2018
Sold by
Claycomb David Bruce and Claycomb Raquel
Bought by
Claycomb Carolyn Anne
Current Estimated Value
Home Financials for this Owner
Home Financials are based on the most recent Mortgage that was taken out on this home.
Original Mortgage
$132,000
Outstanding Balance
$111,651
Interest Rate
3.94%
Mortgage Type
Stand Alone First
Estimated Equity
$201,125
Purchase Details
Closed on
Feb 26, 2009
Sold by
Claycomb Jackson Reynolds and Claycomb Jack Reynolds
Bought by
Claycomb Jack R and Claycomb Jackson Reynolds
Home Financials for this Owner
Home Financials are based on the most recent Mortgage that was taken out on this home.
Original Mortgage
$195,000
Interest Rate
3.22%
Mortgage Type
Reverse Mortgage Home Equity Conversion Mortgage
Purchase Details
Closed on
Jul 12, 1995
Sold by
Claycomb Jackson Reynolds and James Mary Helen Reynolds
Bought by
Claycomb Jackson Reynolds
Purchase Details
Closed on
Nov 19, 1993
Sold by
Claycomb Jack Reynolds
Bought by
Claycomb Jack Reynolds
Purchase Details
Closed on
Dec 12, 1991
Sold by
James Mary Reynolds
Bought by
James Mary Reynolds
Create a Home Valuation Report for This Property
The Home Valuation Report is an in-depth analysis detailing your home's value as well as a comparison with similar homes in the area
Home Values in the Area
Average Home Value in this Area
Purchase History
| Date | Buyer | Sale Price | Title Company |
|---|---|---|---|
| Claycomb Carolyn Anne | -- | None Available | |
| Claycomb Jack R | -- | Startex 07 Title Company | |
| Claycomb Jackson Reynolds | -- | -- | |
| Claycomb Jack Reynolds | -- | -- | |
| James Mary Reynolds | -- | -- |
Source: Public Records
Mortgage History
| Date | Status | Borrower | Loan Amount |
|---|---|---|---|
| Open | Claycomb Carolyn Anne | $132,000 | |
| Closed | Claycomb Jack R | $195,000 |
Source: Public Records
Tax History Compared to Growth
Tax History
| Year | Tax Paid | Tax Assessment Tax Assessment Total Assessment is a certain percentage of the fair market value that is determined by local assessors to be the total taxable value of land and additions on the property. | Land | Improvement |
|---|---|---|---|---|
| 2025 | $1,079 | $288,360 | $78,667 | $209,693 |
| 2024 | $1,079 | $279,793 | $71,330 | $208,463 |
| 2023 | $1,079 | $287,484 | $71,330 | $216,154 |
| 2022 | $81 | $248,475 | $59,510 | $188,965 |
| 2021 | $5,270 | $202,165 | $59,510 | $142,655 |
| 2020 | $5,330 | $202,316 | $53,436 | $148,880 |
| 2019 | $5,022 | $191,612 | $31,974 | $159,638 |
| 2018 | $19 | $177,555 | $31,974 | $145,581 |
| 2017 | $4,663 | $177,555 | $31,974 | $145,581 |
| 2016 | $4,267 | $162,454 | $24,528 | $137,926 |
| 2015 | $677 | $156,985 | $24,528 | $132,457 |
| 2014 | $677 | $137,143 | $18,834 | $118,309 |
Source: Public Records
Map
Nearby Homes
- 8126 Ivan Reid Dr
- 8111 Ivan Reid Dr
- 8715 Andante Dr
- 9114 Brahms Ln
- 9315 Woodwind Lakes Dr
- 9118 Woodwind Lakes Dr
- 8418 Westnut Ln
- 7714 Rolling Fork Ln
- 7802 Percussion Place
- 7915 Corrian Park Cir
- 8315 Terrace Wind Dr
- 8302 Country Wind Ln
- 8403 Cienna Dr
- 7823 Redlands Dr
- 8502 Laurel Trace
- 8227 Prairie Wind Ln
- 8315 Whisper Point Dr
- 9430 Oratorio Ct
- 8315 Terrace Brook Dr
- 8026 Clarion Way
- 8211 Debbie Gay Dr
- 8219 Debbie Gay Dr
- 8210 Tiger Ln
- 8214 Tiger Ln
- 8206 Tiger Ln
- 8207 Debbie Gay Dr
- 8223 Debbie Gay Dr
- 8214 Debbie Gay Dr
- 8218 Tiger Ln
- 8218 Debbie Gay Dr
- 8210 Debbie Gay Dr
- 8202 Tiger Ln
- 8203 Debbie Gay Dr
- 8206 Debbie Gay Dr
- 8222 Debbie Gay Dr
- 8126 Tiger Ln
- 8202 Debbie Gay Dr
- 8135 Debbie Gay Dr
- 8303 Debbie Gay Dr
- 8211 Tiger Ln