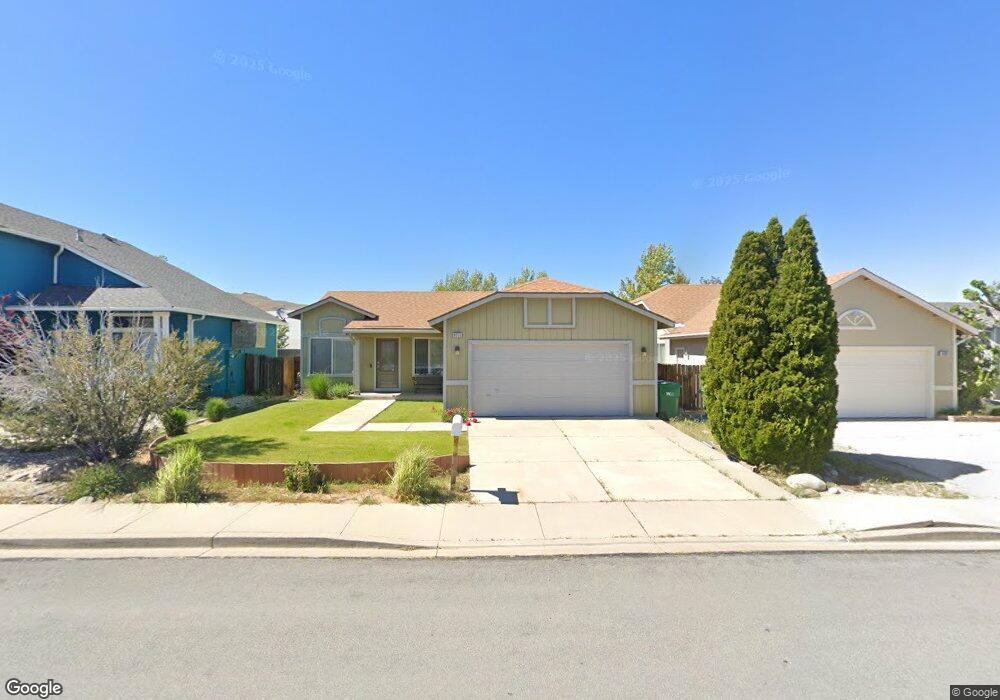
8215 Shifting Sands Dr Reno, NV 89506
Stead NeighborhoodEstimated Value: $401,000 - $407,976
2
Beds
2
Baths
1,254
Sq Ft
$322/Sq Ft
Est. Value
About This Home
This home is located at 8215 Shifting Sands Dr, Reno, NV 89506 and is currently estimated at $403,994, approximately $322 per square foot. 8215 Shifting Sands Dr is a home located in Washoe County with nearby schools including Silver Lake Elementary School, Cold Springs Middle School, and North Valleys High School.
Ownership History
Date
Name
Owned For
Owner Type
Purchase Details
Closed on
May 20, 2009
Sold by
First Horizon Home Loans
Bought by
The Secretary Of Veterans Affairs
Current Estimated Value
Home Financials for this Owner
Home Financials are based on the most recent Mortgage that was taken out on this home.
Original Mortgage
$111,460
Interest Rate
5.59%
Mortgage Type
VA
Purchase Details
Closed on
May 18, 2009
Sold by
Secretary Of Veterans Affairs
Bought by
Humphrey James
Home Financials for this Owner
Home Financials are based on the most recent Mortgage that was taken out on this home.
Original Mortgage
$111,460
Interest Rate
5.59%
Mortgage Type
VA
Purchase Details
Closed on
Feb 11, 2009
Sold by
Barkman Dale W and Barkman Dorothy D
Bought by
Fhhlc and Ft Mortgage Companies
Purchase Details
Closed on
Nov 2, 1998
Sold by
Barkman Dale W and Barkman Dorothy D
Bought by
Barkman Dale W and Barkman Dorothy D
Purchase Details
Closed on
Jun 16, 1997
Sold by
Lewis Homes Of Nevada
Bought by
Barkman Dale W and Barkman Dorothy D
Home Financials for this Owner
Home Financials are based on the most recent Mortgage that was taken out on this home.
Original Mortgage
$125,562
Interest Rate
7.44%
Mortgage Type
VA
Create a Home Valuation Report for This Property
The Home Valuation Report is an in-depth analysis detailing your home's value as well as a comparison with similar homes in the area
Home Values in the Area
Average Home Value in this Area
Purchase History
| Date | Buyer | Sale Price | Title Company |
|---|---|---|---|
| The Secretary Of Veterans Affairs | -- | None Available | |
| Humphrey James | $108,000 | North American Title Company | |
| Fhhlc | $138,995 | Landamerica | |
| Barkman Dale W | -- | -- | |
| Barkman Dale W | $122,000 | United Title |
Source: Public Records
Mortgage History
| Date | Status | Borrower | Loan Amount |
|---|---|---|---|
| Previous Owner | Humphrey James | $111,460 | |
| Previous Owner | Barkman Dale W | $125,562 |
Source: Public Records
Tax History
| Year | Tax Paid | Tax Assessment Tax Assessment Total Assessment is a certain percentage of the fair market value that is determined by local assessors to be the total taxable value of land and additions on the property. | Land | Improvement |
|---|---|---|---|---|
| 2026 | $1,494 | $75,307 | $31,089 | $44,218 |
| 2024 | $1,851 | $73,165 | $27,531 | $45,634 |
| 2023 | $1,715 | $69,713 | $26,401 | $43,312 |
| 2022 | $1,589 | $59,340 | $23,142 | $36,198 |
| 2021 | $1,471 | $54,268 | $18,121 | $36,147 |
| 2020 | $1,383 | $53,855 | $17,556 | $36,299 |
| 2019 | $1,318 | $52,467 | $17,323 | $35,144 |
| 2018 | $1,233 | $46,038 | $12,269 | $33,769 |
| 2017 | $1,182 | $45,315 | $11,438 | $33,877 |
| 2016 | $1,153 | $44,807 | $10,141 | $34,666 |
| 2015 | $1,152 | $43,197 | $8,512 | $34,685 |
| 2014 | $1,113 | $38,556 | $6,816 | $31,740 |
| 2013 | -- | $29,782 | $4,988 | $24,794 |
Source: Public Records
Map
Nearby Homes
- 8451 Seal Beach Dr
- 7973 Moss Creek Dr
- 7871 Anchor Point Ct
- 8000 Monterey Shores Dr
- 7975 Monterey Shores Dr
- 8655 Silver Shores Dr
- 8651 Beechcraft Dr
- 9500 N Red Rock Rd
- Red Rock 19.82 Acres
- 7690 E Key Largo Ct
- 8455 Red Baron Blvd
- 7435 Hinton Dr
- 8821 Sunset Breeze Dr
- 0 Duffney Ln
- 8944 Red Baron Blvd
- 9000 Red Baron Blvd
- 6769 Peppermint Ct
- 3720 N Virginia St
- 6451 Flower St
- 10605 Osage Rd
- 8205 Shifting Sands Dr
- 8235 Shifting Sands Dr
- 8195 Shifting Sands Dr
- 8245 Shifting Sands Dr
- 8185 Shifting Sands Dr
- 8210 Shifting Sands Dr
- 8200 Shifting Sands Dr
- 8220 Shifting Sands Dr
- 8230 Shifting Sands Dr
- 8175 Shifting Sands Dr
- 8190 Shifting Sands Dr
- 8255 Shifting Sands Dr
- 8180 Shifting Sands Dr
- 8240 Shifting Sands Dr
- 8265 Shifting Sands Dr
- 8165 Shifting Sands Dr
- 8250 Shifting Sands Dr
- 8170 Shifting Sands Dr
- 8207 Anchor Point Dr
- 8197 Anchor Point Dr
Your Personal Tour Guide
Ask me questions while you tour the home.