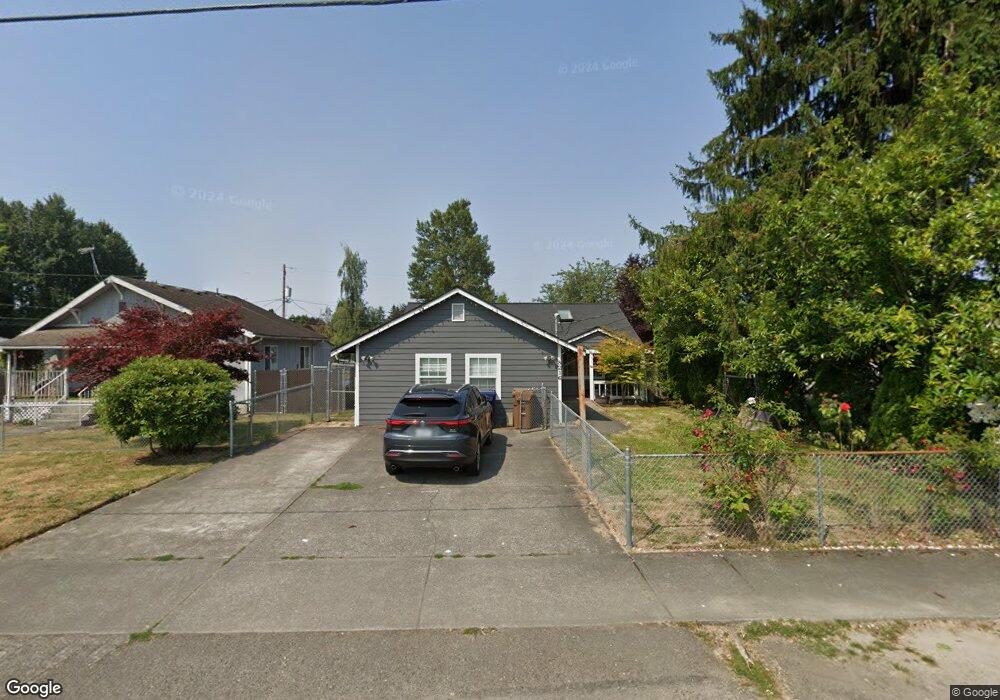
8216 E D St Tacoma, WA 98404
South End NeighborhoodEstimated Value: $443,000 - $554,000
4
Beds
2
Baths
1,745
Sq Ft
$289/Sq Ft
Est. Value
About This Home
This home is located at 8216 E D St, Tacoma, WA 98404 and is currently estimated at $503,670, approximately $288 per square foot. 8216 E D St is a home located in Pierce County with nearby schools including Larchmont Elementary School, Baker Middle School, and Mount Tahoma High School.
Ownership History
Date
Name
Owned For
Owner Type
Purchase Details
Closed on
Feb 6, 2008
Sold by
Sloan Jason B
Bought by
Group Action For Peninsula People
Current Estimated Value
Home Financials for this Owner
Home Financials are based on the most recent Mortgage that was taken out on this home.
Original Mortgage
$175,000
Outstanding Balance
$111,019
Interest Rate
6.17%
Mortgage Type
Purchase Money Mortgage
Estimated Equity
$392,651
Purchase Details
Closed on
May 5, 2005
Sold by
Martinez Guillermo
Bought by
Sloan Jason B
Home Financials for this Owner
Home Financials are based on the most recent Mortgage that was taken out on this home.
Original Mortgage
$159,960
Interest Rate
5.37%
Mortgage Type
New Conventional
Purchase Details
Closed on
Sep 3, 2003
Sold by
Ngeth Samban
Bought by
Martinez Guillermo and Decastelan Gabriela
Home Financials for this Owner
Home Financials are based on the most recent Mortgage that was taken out on this home.
Original Mortgage
$138,360
Interest Rate
5.87%
Mortgage Type
Purchase Money Mortgage
Purchase Details
Closed on
Apr 28, 2001
Sold by
Carbajal Juan
Bought by
Ngeth Samban and Ngeth Vasana
Home Financials for this Owner
Home Financials are based on the most recent Mortgage that was taken out on this home.
Original Mortgage
$147,632
Interest Rate
6.98%
Mortgage Type
FHA
Purchase Details
Closed on
Jul 30, 1996
Sold by
Hud
Bought by
Carbajal Juan and Carbajal Katrina
Home Financials for this Owner
Home Financials are based on the most recent Mortgage that was taken out on this home.
Original Mortgage
$80,624
Interest Rate
8.32%
Mortgage Type
FHA
Purchase Details
Closed on
Jan 4, 1996
Sold by
Citicorp Mtg Inc
Bought by
Hud
Home Financials for this Owner
Home Financials are based on the most recent Mortgage that was taken out on this home.
Original Mortgage
$73,450
Interest Rate
7.58%
Purchase Details
Closed on
Nov 17, 1995
Sold by
Stafford John A and Stafford Louise A
Bought by
Citicorp Mtg Inc
Home Financials for this Owner
Home Financials are based on the most recent Mortgage that was taken out on this home.
Original Mortgage
$73,450
Interest Rate
7.58%
Create a Home Valuation Report for This Property
The Home Valuation Report is an in-depth analysis detailing your home's value as well as a comparison with similar homes in the area
Home Values in the Area
Average Home Value in this Area
Purchase History
We collect this data history from publicly available records. To have your information removed, we recommend requesting removal directly through your county’s website.
| Date | Buyer | Sale Price | Title Company |
|---|---|---|---|
| Group Action For Peninsula People | $240,000 | Pnwt | |
| Sloan Jason B | $199,950 | Transnation Title | |
| Martinez Guillermo | $172,950 | Rainier Title Company | |
| Ngeth Samban | $149,950 | Rainier Title Company | |
| Carbajal Juan | -- | -- | |
| Hud | -- | -- | |
| Citicorp Mtg Inc | $95,701 | Chicago Title |
Source: Public Records
Mortgage History
We collect this data history from publicly available records. To have your information removed, we recommend requesting removal directly through your county’s website.
| Date | Status | Borrower | Loan Amount |
|---|---|---|---|
| Open | Group Action For Peninsula People | $175,000 | |
| Previous Owner | Sloan Jason B | $159,960 | |
| Previous Owner | Martinez Guillermo | $138,360 | |
| Previous Owner | Ngeth Samban | $147,632 | |
| Previous Owner | Carbajal Juan | $80,624 | |
| Previous Owner | Citicorp Mtg Inc | $73,450 | |
| Closed | Martinez Guillermo | $34,590 | |
| Closed | Sloan Jason B | $39,990 |
Source: Public Records
Tax History
| Year | Tax Paid | Tax Assessment Tax Assessment Total Assessment is a certain percentage of the fair market value that is determined by local assessors to be the total taxable value of land and additions on the property. | Land | Improvement |
|---|---|---|---|---|
| 2025 | $12 | $509,100 | $193,400 | $315,700 |
| 2024 | $12 | $478,800 | $186,300 | $292,500 |
| 2023 | $12 | $445,700 | $177,400 | $268,300 |
| 2022 | $12 | $466,400 | $166,600 | $299,800 |
| 2021 | $12 | $334,700 | $106,100 | $228,600 |
| 2019 | $10 | $304,000 | $87,700 | $216,300 |
| 2018 | $9 | $274,700 | $71,000 | $203,700 |
| 2017 | $8 | $242,000 | $57,100 | $184,900 |
| 2016 | $7 | $181,800 | $42,700 | $139,100 |
| 2014 | $7 | $168,600 | $40,300 | $128,300 |
| 2013 | $7 | $148,500 | $35,500 | $113,000 |
Source: Public Records
Map
Nearby Homes
- 8235 E B St
- 308 E 84th St
- 614 E 84th St
- 416 E 86th St
- 8446 E B St
- 521 E 78th St
- 8025 S Bell St
- 7918 Mckinley Ave
- 803 82nd Street Ct E Unit 14
- 111 S 80th St
- 818 82nd St E Unit 6
- 8818 E D St
- 8518 9th Ave E
- 301 S 82nd St
- 917 85th St E
- 7656 Pacific Ave
- 230 S 79th St
- 8421 S D St
- 7603 Pacific Ave
- 8428 S D St
Your Personal Tour Guide
Ask me questions while you tour the home.