
Estimated payment $3,944/month
Total Views
26,606
3
Beds
4
Baths
2,130
Sq Ft
$282
Price per Sq Ft
Highlights
- Updated Kitchen
- Mature Trees
- Private Lot
- Canyon View School Rated A-
- Mountain View
- Wood Flooring
About This Home
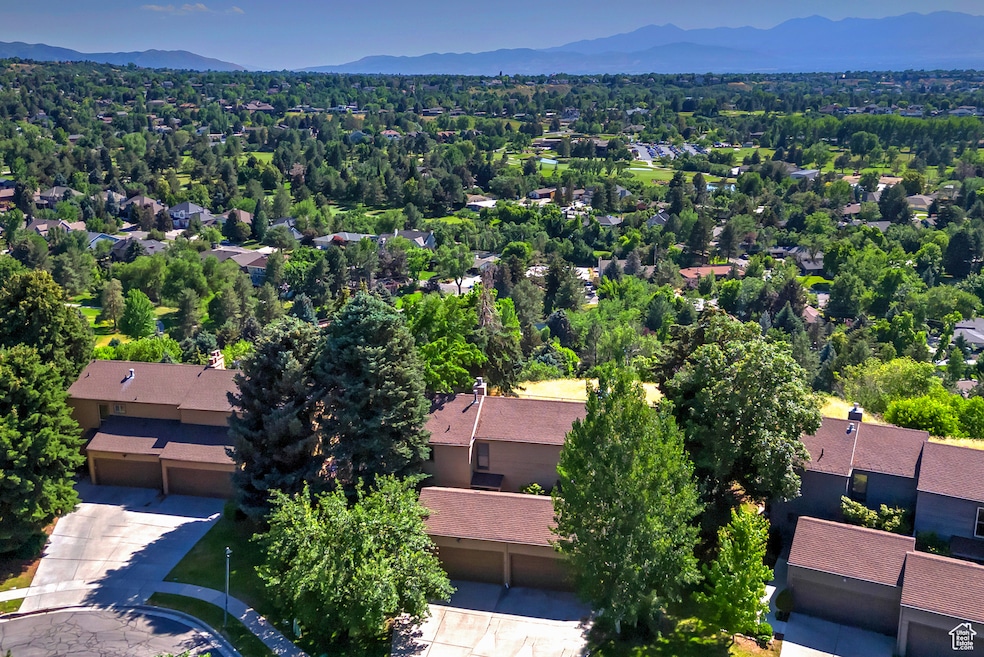
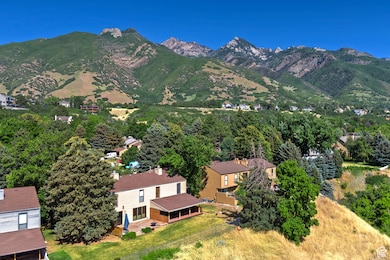
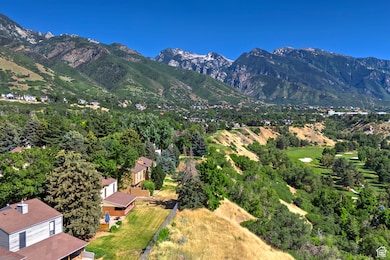
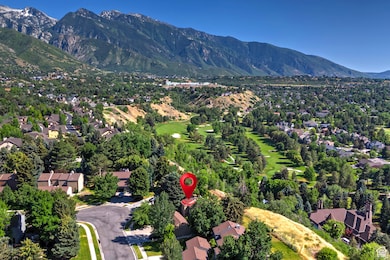
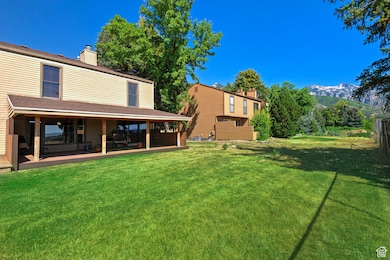
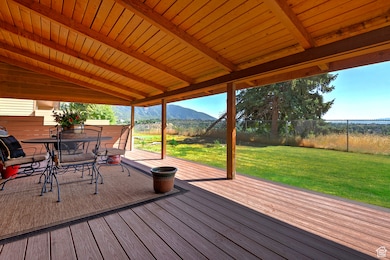
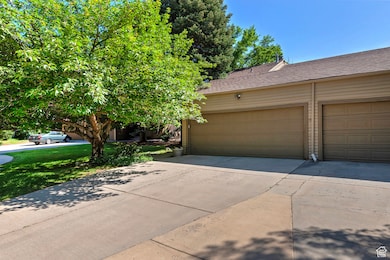
Discover this stunning townhouse in the exclusive community of Scandia Village-a serene enclave of just 24 buildings spread across 7 beautifully landscaped acres of lush grass and mature trees, surrounded by multimillion-dollar estates. Situated in one of the most desirable and private locations within the community, this residence offers unobstructed, panoramic views of the valley and mountains with no backyard neighbors. Step outside to a brand-new, maintenance-free Trex deck-an ideal space for morning coffee or evening relaxation. This private outdoor retreat is perfectly positioned to capture expansive vistas overlooking Willow Creek Country Club, making it one of the home's standout features. Inside, the open-concept layout is designed for both comfort and functionality, with stainless steel appliances in the kitchen and an effortless flow ideal for everyday living or entertaining. The home also includes a two-car garage and offers easy access to shopping, dining, entertainment, and is just 20 minutes from some of Utah's world-class ski resorts. Whether you're looking for a peaceful retreat with unmatched scenery or a well-located home in a quiet, upscale community, this townhouse delivers the best of both worlds.
Townhouse Details
Home Type
- Townhome
Est. Annual Taxes
- $2,974
Year Built
- Built in 1975
Lot Details
- 436 Sq Ft Lot
- Partially Fenced Property
- Landscaped
- Sprinkler System
- Mature Trees
- Pine Trees
- Wooded Lot
HOA Fees
- $411 Monthly HOA Fees
Parking
- 2 Car Garage
Property Views
- Mountain
- Valley
Home Design
- Cedar
Interior Spaces
- 2,130 Sq Ft Home
- 3-Story Property
- Ceiling Fan
- Gas Log Fireplace
- Double Pane Windows
- Blinds
- Sliding Doors
- Partial Basement
Kitchen
- Updated Kitchen
- Built-In Range
- Microwave
- Disposal
Flooring
- Wood
- Carpet
- Tile
Bedrooms and Bathrooms
- 3 Bedrooms
Laundry
- Dryer
- Washer
Schools
- Brookwood Elementary School
- Butler Middle School
- Brighton High School
Utilities
- Forced Air Heating and Cooling System
- Natural Gas Connected
Listing and Financial Details
- Assessor Parcel Number 22-35-327-020
Community Details
Overview
- Association fees include insurance, ground maintenance
- Iamhoa.Com Association
- Scandia Village Subdivision
Recreation
- Snow Removal
Pet Policy
- Pets Allowed
Map
Create a Home Valuation Report for This Property
The Home Valuation Report is an in-depth analysis detailing your home's value as well as a comparison with similar homes in the area
Home Values in the Area
Average Home Value in this Area
Tax History
| Year | Tax Paid | Tax Assessment Tax Assessment Total Assessment is a certain percentage of the fair market value that is determined by local assessors to be the total taxable value of land and additions on the property. | Land | Improvement |
|---|---|---|---|---|
| 2023 | $2,974 | $504,700 | $151,400 | $353,300 |
| 2022 | $0 | $468,100 | $140,400 | $327,700 |
| 2021 | $2,353 | $335,000 | $100,500 | $234,500 |
| 2020 | $2,441 | $326,700 | $98,000 | $228,700 |
| 2019 | $2,452 | $318,600 | $95,600 | $223,000 |
| 2018 | $0 | $316,400 | $94,900 | $221,500 |
| 2017 | $2,142 | $280,700 | $84,200 | $196,500 |
| 2016 | $1,984 | $252,200 | $75,600 | $176,600 |
| 2015 | $2,038 | $240,000 | $72,000 | $168,000 |
| 2014 | -- | $237,600 | $71,300 | $166,300 |
Source: Public Records
Property History
| Date | Event | Price | Change | Sq Ft Price |
|---|---|---|---|---|
| 07/14/2025 07/14/25 | Pending | -- | -- | -- |
| 06/20/2025 06/20/25 | For Sale | $600,000 | -- | $282 / Sq Ft |
Source: UtahRealEstate.com
Purchase History
| Date | Type | Sale Price | Title Company |
|---|---|---|---|
| Interfamily Deed Transfer | -- | None Available | |
| Warranty Deed | -- | Cottonwood Title Ins Agency | |
| Warranty Deed | -- | United Title Services | |
| Warranty Deed | -- | Founders Title Co |
Source: Public Records
Mortgage History
| Date | Status | Loan Amount | Loan Type |
|---|---|---|---|
| Open | $222,400 | Unknown | |
| Previous Owner | $145,000 | No Value Available | |
| Previous Owner | $161,500 | No Value Available |
Source: Public Records
About the Listing Agent
I am an award-winning real estate professional recently ranked No. 1 in Salt Lake City and No. 94 in the nation by REAL Trends Inc. The Wall Street Journal published accolades in the 11th-annual The Thousand, a list of America's top 1,000 real estate sales professionals and teams.
I specialize in physician relocation services; however, I have helped hundreds of families, individuals, students, young professionals, newly-married couples and retirees buy and sell homes on the Wasatch Front
Joel's Other Listings
Source: UtahRealEstate.com
MLS Number: 2093646
APN: 22-35-327-020-0000
Disclaimer: Certain information contained herein is derived from information provided by parties other than Homes.com. All information provided is deemed reliable, but is not guaranteed to be accurate and should be independently verified.
![]() IDX information is provided exclusively for consumers’ personal, non-commercial use, that it may not be used for any purpose other than to identify prospective properties consumers may be interested in purchasing, and that the data is deemed reliable but is not guaranteed accurate by the MLS. Licensor is only providing the MLS Content and not other sources of data provided in the Product.
IDX information is provided exclusively for consumers’ personal, non-commercial use, that it may not be used for any purpose other than to identify prospective properties consumers may be interested in purchasing, and that the data is deemed reliable but is not guaranteed accurate by the MLS. Licensor is only providing the MLS Content and not other sources of data provided in the Product.
Based on information from the Wasatch Front Regional Multiple Listing Service, Inc.. All data, including all measurements and calculations of area, is obtained from various sources and has not been, and will not be, verified by broker or the MLS. All information should be independently reviewed and verified for accuracy. Properties may or may not be listed by the office/agent presenting the information.
Nearby Homes
- 2986 E Scandia Way
- 8179 Nordic Cir
- 3143 E Bavarian Ct
- 3181 E Deer Creek Cove
- 3270 E Danish Hills Cir
- 2825 Elk Horn Ln
- 8103 S Deer Creek Rd
- 8022 Deer Creek Rd
- 3231 Lantern Hill Ct
- 2756 Water Vista Way
- 2935 E Denmark Dr
- 3276 E Scottish Dr
- 3195 E Willowcrest Rd
- 2968 Danish Brook Cir
- 7913 Danish Pine Ln Unit 1
- 3354 Rutland Place
- 8697 Willow Green Cir
- 8711 Rustler Rd
- 3548 Wasatch Hills Ln
- 8135 Clover Spring Ln