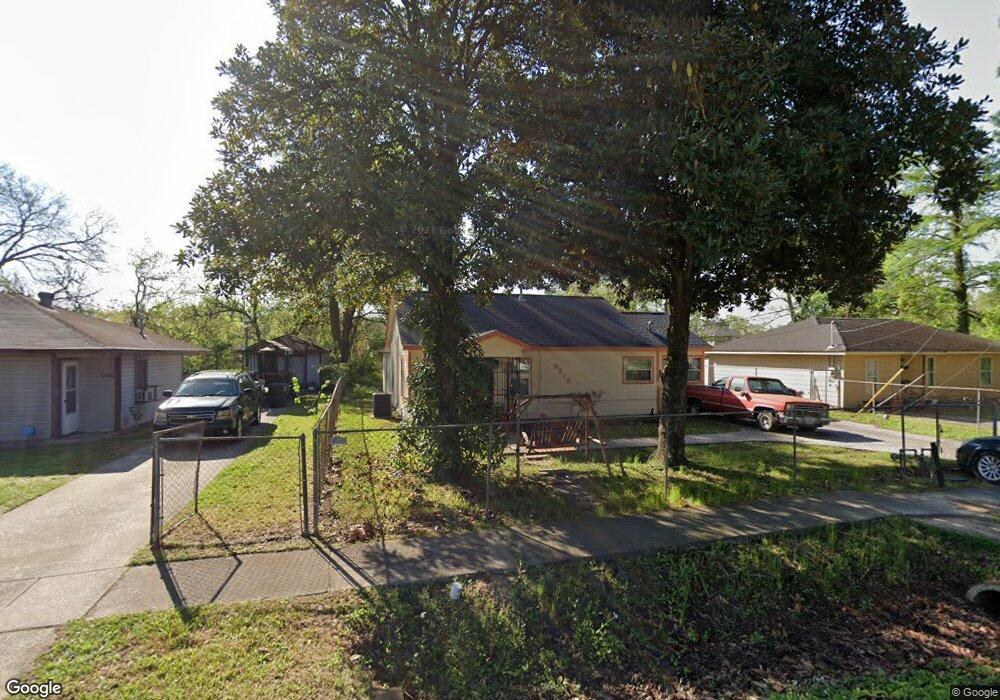
8216 Spaulding St Houston, TX 77016
Trinity-Houston Gardens NeighborhoodEstimated Value: $194,404 - $208,000
3
Beds
2
Baths
1,040
Sq Ft
$192/Sq Ft
Est. Value
About This Home
This home is located at 8216 Spaulding St, Houston, TX 77016 and is currently estimated at $199,351, approximately $191 per square foot. 8216 Spaulding St is a home located in Harris County with nearby schools including Felix Cook Jr. Elementary School, Key Middle, and Kashmere High School.
Ownership History
Date
Name
Owned For
Owner Type
Purchase Details
Closed on
Jan 10, 2013
Sold by
Bank Of New York Mellon
Bought by
West Willie and West Mary
Current Estimated Value
Purchase Details
Closed on
Dec 2, 2012
Sold by
Hines Tracey
Bought by
Bank Of New York Mellon and Bank Of New York
Purchase Details
Closed on
Jul 28, 2005
Sold by
West Willie L and West Mary L
Bought by
Hines Tracey
Home Financials for this Owner
Home Financials are based on the most recent Mortgage that was taken out on this home.
Original Mortgage
$75,000
Interest Rate
10.87%
Mortgage Type
New Conventional
Purchase Details
Closed on
May 5, 2002
Sold by
Hyde Jesse F and Hyde Essie M
Bought by
West Willie L and West Mary L
Purchase Details
Closed on
Aug 19, 1996
Sold by
Hyde Jesse F and Hyde Essie M
Bought by
West Willie and West Mary
Home Financials for this Owner
Home Financials are based on the most recent Mortgage that was taken out on this home.
Original Mortgage
$30,000
Interest Rate
8.15%
Mortgage Type
Seller Take Back
Create a Home Valuation Report for This Property
The Home Valuation Report is an in-depth analysis detailing your home's value as well as a comparison with similar homes in the area
Home Values in the Area
Average Home Value in this Area
Purchase History
| Date | Buyer | Sale Price | Title Company |
|---|---|---|---|
| West Willie | -- | Lsi Title Agency Inc | |
| Bank Of New York Mellon | $28,260 | None Available | |
| Hines Tracey | -- | American Title Co | |
| West Willie L | -- | -- | |
| West Willie | -- | -- |
Source: Public Records
Mortgage History
| Date | Status | Borrower | Loan Amount |
|---|---|---|---|
| Previous Owner | Hines Tracey | $75,000 | |
| Previous Owner | West Willie | $30,000 |
Source: Public Records
Tax History Compared to Growth
Tax History
| Year | Tax Paid | Tax Assessment Tax Assessment Total Assessment is a certain percentage of the fair market value that is determined by local assessors to be the total taxable value of land and additions on the property. | Land | Improvement |
|---|---|---|---|---|
| 2025 | $2,110 | $149,136 | $54,600 | $94,536 |
| 2024 | $2,110 | $134,924 | $51,480 | $83,444 |
| 2023 | $2,110 | $140,310 | $46,800 | $93,510 |
| 2022 | $2,096 | $111,140 | $39,000 | $72,140 |
| 2021 | $2,017 | $87,473 | $19,500 | $67,973 |
| 2020 | $1,905 | $82,488 | $19,500 | $62,988 |
| 2019 | $1,810 | $82,488 | $19,500 | $62,988 |
| 2018 | $78 | $65,025 | $17,550 | $47,475 |
| 2017 | $1,644 | $65,025 | $17,550 | $47,475 |
| 2016 | $1,593 | $62,982 | $17,550 | $45,432 |
| 2015 | $198 | $58,160 | $17,550 | $40,610 |
| 2014 | $198 | $58,160 | $17,550 | $40,610 |
Source: Public Records
Map
Nearby Homes
- 8312 Lanewood Dr
- 8218 Bertwood St
- 0 Shreveport Blvd
- 6606 Weaver Rd
- 8420 Lanewood Dr
- 6705 Roanoke St
- 8502 Shady Dr
- 7910 Allwood St
- 6719 Roanoke St
- 6838 Carothers St
- 6908 S Hall St
- 6842 Carothers St
- 7002 S Hall St
- 8514 Spaulding St
- 6908 Larkstone St
- 7010 S Hall St
- 7904 Hoffman St
- 6601 Landor St
- 8634 Allwood St
- 8700 Lanewood Dr
- 8214 Spaulding St
- 8220 Spaulding St
- 8224 Spaulding St
- 8221 Westcott Rd
- 8223 Westcott Rd
- 8208 Spaulding St
- 8230 Spaulding St
- 8229 Westcott Rd
- 8217 Spaulding St
- 8213 Spaulding St
- 8233 Westcott Rd
- 8225 Spaulding St
- 8231 Spaulding St
- 8237 Westcott Rd
- 8241 Westcott Rd
- 8211 Westcott Rd
- 8305 Spaulding St
- 8318 Shady Dr
- 8301 Westcott Rd
- 8209 Westcott Rd