Estimated Value: $590,000 - $653,870
4
Beds
2
Baths
1,280
Sq Ft
$491/Sq Ft
Est. Value
About This Home
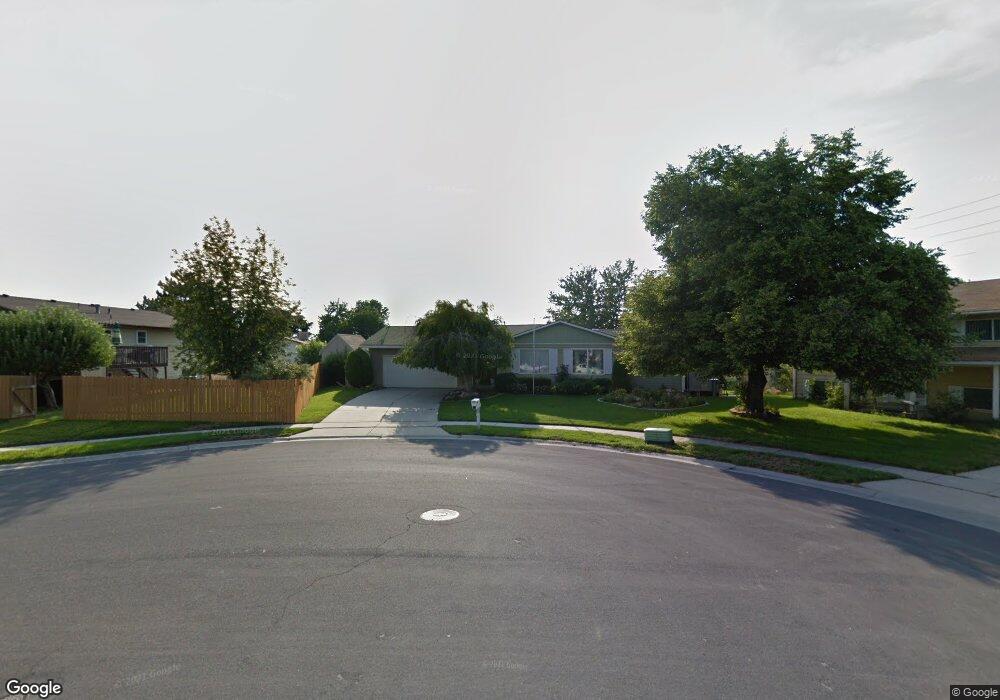
This home is located at 8216 Valencia Place, Sandy, UT 84093 and is currently estimated at $628,968, approximately $491 per square foot. 8216 Valencia Place is a home located in Salt Lake County with nearby schools including Peruvian Park Elementary School, Hillcrest High School, and Union Middle School.
Ownership History
Date
Name
Owned For
Owner Type
Purchase Details
Closed on
Aug 28, 2019
Sold by
Claybaugh Dennis and Claybaugh Chad
Bought by
Jardine Kenneth and Jardine Madison
Current Estimated Value
Home Financials for this Owner
Home Financials are based on the most recent Mortgage that was taken out on this home.
Original Mortgage
$341,910
Outstanding Balance
$300,704
Interest Rate
3.8%
Mortgage Type
New Conventional
Estimated Equity
$328,264
Purchase Details
Closed on
Jan 25, 2019
Sold by
Claybaugh Christine Haight and The Francis David Haight Livin
Bought by
Claybaugh Dennis and Claybaugh Chad
Home Financials for this Owner
Home Financials are based on the most recent Mortgage that was taken out on this home.
Original Mortgage
$250,000
Interest Rate
4.6%
Mortgage Type
Commercial
Purchase Details
Closed on
Apr 4, 2011
Sold by
Haight Francis D
Bought by
Haight Francis David
Create a Home Valuation Report for This Property
The Home Valuation Report is an in-depth analysis detailing your home's value as well as a comparison with similar homes in the area
Home Values in the Area
Average Home Value in this Area
Purchase History
| Date | Buyer | Sale Price | Title Company |
|---|---|---|---|
| Jardine Kenneth | -- | Eagle Gate Title Ins Agcy | |
| Claybaugh Dennis | -- | Eagle Gate Title Ins Agcy | |
| Haight Francis David | -- | None Available |
Source: Public Records
Mortgage History
| Date | Status | Borrower | Loan Amount |
|---|---|---|---|
| Open | Jardine Kenneth | $341,910 | |
| Previous Owner | Claybaugh Dennis | $250,000 |
Source: Public Records
Tax History Compared to Growth
Tax History
| Year | Tax Paid | Tax Assessment Tax Assessment Total Assessment is a certain percentage of the fair market value that is determined by local assessors to be the total taxable value of land and additions on the property. | Land | Improvement |
|---|---|---|---|---|
| 2025 | $2,911 | $617,100 | $173,000 | $444,100 |
| 2024 | $2,911 | $545,600 | $160,200 | $385,400 |
| 2023 | $2,840 | $531,400 | $152,200 | $379,200 |
| 2022 | $2,945 | $542,100 | $149,300 | $392,800 |
| 2021 | $2,553 | $400,100 | $134,300 | $265,800 |
| 2020 | $2,400 | $354,900 | $122,900 | $232,000 |
| 2019 | $1,848 | $266,600 | $115,900 | $150,700 |
| 2018 | $0 | $260,900 | $115,900 | $145,000 |
| 2017 | $1,737 | $250,700 | $115,900 | $134,800 |
| 2016 | $1,716 | $239,400 | $115,900 | $123,500 |
| 2015 | $1,745 | $225,800 | $120,600 | $105,200 |
| 2014 | -- | $216,200 | $117,100 | $99,100 |
Source: Public Records
Map
Nearby Homes
- 1327 Madrid Way
- 1235 E Cottonwood Hills Dr
- 1263 E Cottonwood Hills Dr
- 1169 E Cottonwood Hills Dr Unit 56
- 8149 S Cottonwood Hills Cir Unit 158149
- 1597 Paulista Way
- 1666 Paulista Way
- 1077 E 8320 S Unit 18
- 8017 S Showcase Ln
- 8335 S 1050 E
- 8492 S Mesa Dr
- 1430 E 8685 S
- 1341 E Creek Rd
- 1393 E Galaxie Dr
- 7734 S 1100 E
- 7641 Mary Esther Cir
- 8638 Piper Ln
- 8643 Vaquero Dr
- 842 E 8270 S
- 909 E 7865 S
- 8216 S Valencia Place
- 8210 S Valencia Place
- 8210 Valencia Place
- 1349 Madrid Way
- 8207 S 1330 E
- 8219 S 1330 E
- 1337 Madrid Way
- 1362 E 8175 S
- 1352 E 8175 S
- 8209 Valencia Place
- 1372 E 8175 S
- 8227 Valencia Place
- 8217 Valencia Place
- 1384 E 8175 S
- 8206 S 1330 E
- 8246 Valencia Cir
- 8246 S Valencia Cir
- 1338 Madrid Way
- 8224 Mulberry Way
- 8224 S Mulberry Way